
Temu Watch 10: Logistics in times of tariffs
How Temu adjusted its logistical processes when import tax exemptions disappeared.

Content
Things that caught our attention
Three coffee store chains are now bigger than Starbucks China
It seems I was wrong about the demise of community group-buying
Five things you probably did not know about EngineAI that Rui researched for you.
Introduction
In the August report, Temu Watch #9: Temu’s US Recovery, we described how Temu quickly recovered from its sharp sales decline following the cancellation of the US de minimis tax exemption. As we approach the end of 2025, Temu once again demonstrates its remarkable agility as it anticipates and prepares for evolving conditions in its most important markets. In the EU, plans to remove the €150 de minimis threshold are being brought forward from 2028 to 2026, and, as it did in the US, Temu is preparing for this.
In a set of two new Temu Watch updates, we’ll share new and updated insights gleaned from more than 10 expert interviews with people close to Temu.
In the first of these, Temu Watch 10, we will examine the current situation across different markets and the impact of tariffs. We have made this report free to read for everybody and have put a video summary at the end of the report, created with Google Notebook.
In the second part, Temu Watch 11, we will take a closer look at developments in Temu’s pricing strategy, order values, GMV, profitability, and the outlook for 2026 and beyond. This report will be available to paid subscribers only. Become a paying subscriber to unlock the full report and support our in-depth research into key China tech trends.
Note: this report is compiled from the insights of 10+ experts. Sometimes their individual claims, especially regarding specific data, conflict to some extent. Instead of removing ambiguous information that still sounds plausible or selecting a single expert, we have left these slightly conflicting claims in the text so readers can weigh them.
Ed Sander, Tech Research Analyst

Markets
According to Sensor Tower data, Temu remains the world’s leading e-commerce app in both downloads and monthly active users (MAU). As of October 2025, Temu’s cumulative global downloads exceeded 1.2 billion, and its monthly global active users reached a record high of 530 million in August 2025. [1] According to We Are Social, Amazon, Temu, and AliExpress will be the top three most-visited global e-commerce platforms in 2025, with 2.7 billion, 1.6 billion, and 646 million monthly visits, respectively. [2]
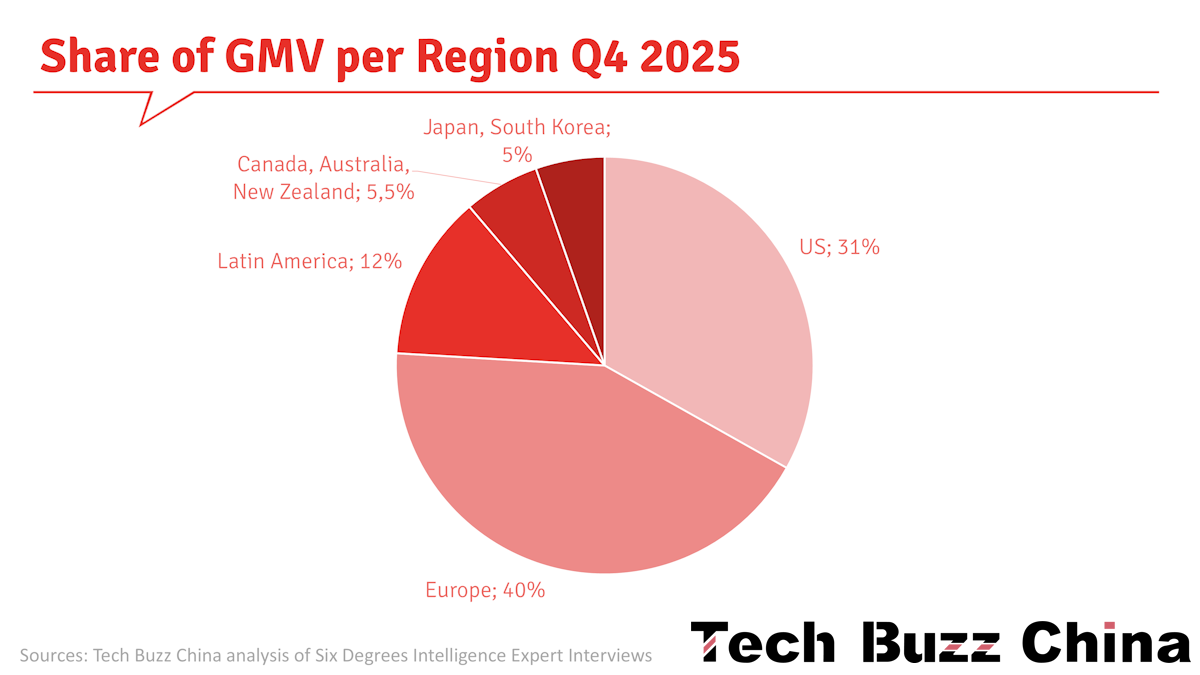
Temu’s global merchandise transaction volume (GMV) will reach between $22 billion and $25 billion in the third quarter of 2025, representing a year-over-year growth of 40% to 60%. Temu’s performance in markets outside the US was particularly outstanding in the third quarter, especially in Europe, Latin America, Central and Eastern Europe, and Southeast Asia.
The US market currently accounts for 31% of Temu’s GMV, but its growth has slowed due to tariff policies, while the European market has a larger share (40%) and strong growth (80%-100%).
USA
At the end of April, days before the de minimis tax exemption closed on May 2nd, Temu suspended its fully managed model in the US, as described in Temu Watch #8. This meant the complete closure of shipments of direct-to-consumer packages to US consumers. However, months before the imminent conclusion of the de minimis, Temu had adjusted its strategy, demonstrating its rapid response capabilities. Specifically, in the one to two months before the end of the fully managed model, Temu transitioned some popular products from the fully managed model to forward warehouses, with the platform handling shipping, or to the semi-managed model, with merchants responsible for logistics.
With the tariff rates coming down in mid-May, Temu reactivated the fully managed model and continued to optimise supply chain operations. These adjustments demonstrate Temu’s high efficiency in policy implementation and adjustment, as well as its swift decision-making.
From May to June 2025, Temu experienced a decline in sales due to rising product prices. However, starting in July, Temu began advertising, and sales gradually increased. Still, the US share of Temu’s global sales has declined. In 2024, global sales reached $54 billion (some experts estimate $60 billion), with the US accounting for 40% of that total, approximately $21.6 billion. However, by the first half of 2025, the situation had changed. Global sales reached $35 billion, but US sales were only about $12 billion, accounting for less than 35%. While there was some improvement from July onwards in the third quarter, the increase was limited.
The main reason for the July sales rebound was the implementation of the official fully managed model with forward warehouses. That month, Temu was in a period of traffic acquisition, and sales data remained stable, with no significant growth. Sales were expected to recover gradually in the third quarter.
Globally, Temu’s total transaction volume in the first nine months of 2025 increased by approximately 75% compared to the same period in 2024. However, growth in the US market slowed significantly: stable first-quarter performance, a significant decline in the second quarter, and only a brief resumption of fully managed business in July and August of the third quarter, with products relisted, relying mainly on the recovery in September.
By the end of September 2025, order volume in the US market had recovered to 80%-90% of the same period last year. However, in the second half of 2025, US sales were expected to remain relatively flat compared to the first half of the year. At this level, US GMV is expected to reach $24-$27 billion (based on estimates by different experts). While this figure represents a slight increase over 2024, the growth is limited. Still, from a market potential perspective, the US market’s potential has not yet been fully realised. Temu has 100 million registered users, while the total US population is close to 350 million.
Europe
In 2024, Temu’s revenue in the European Union reached $1.7 billion, up 171% from $758 million in 2023. Pre-tax profit surged to $101.4 million, approximately 2.3 times the $44 million reported in the corresponding period of 2023. [3]
Temu has grown its average monthly active users in the EU to 115.7 million in the first half of 2025, up 12.5% from the previous half year, according to its DSA transparency report. [4]
In contrast to slowing growth in the US, Europe saw the fastest transaction volume growth in the first three quarters of 2025, with year-on-year increases of 80%-100%. Europe boasts the fastest GMV growth and the largest share in global sales, but Temu also faces potential risks and competitive pressures in the region. While Amazon’s influence in Europe is not as strong as in the US, it still has a certain impact on Temu. Compared with Temu, Shein poses a greater threat; overall, Temu is less competitive in Europe. However, this year, Temu has outpaced Shein in order volume across five major European countries, including the UK, Germany, and France. Still, its total transaction value remains lower due to a lower average order value.
Meanwhile, in Spain and Italy, Shein surpassed Temu in both order volume and total transaction value. Notably, both Temu and Shein have increased their marketing efforts in Europe and Latin America this year while reducing traffic investment in the US market. Although Shein has not entirely stopped its marketing activities in the US market, its traffic investment has been significantly reduced, and its strategic focus has shifted to Europe and Latin America.
Temu maintains a price advantage compared to Amazon and Shein in the European market (more on this in Temu Watch #11). However, a potential problem in the European market is the expected removal of the €150 tax-free threshold, a policy similar to the US’s former $800 tax-free policy. The likelihood of its removal in 2026 is high, but Temu is well prepared. To address this challenge, Temu plans to reduce logistics fulfilment costs by expanding its semi-managed business and increasing the proportion of overseas bulk shipping, thus mitigating the impact of the tax-free threshold removal.
If Europe eliminates the €150 tax exemption, Temu’s tax burden may be lower than in the United States. This is mainly because the tax rate on Chinese DTC packages in the US is 54%, while in Europe, the rate is unlikely to reach that level once the tax exemption is abolished (the current highest rate is 17%).
However, Temu faces other regulatory challenges in the EU:
Italy plans to impose additional taxes on fast-fashion imports from China, targeting platforms like Temu and Shein, to protect its local industry from low-cost competition. [5]
To combat ‘unfair competition’ from foreign e-commerce platforms and address environmental concerns related to delivery volume, France approved a new regulation to impose a €2 tax on small parcels imported from outside the EU (under €150 value and 3kg weight), beginning in 2026. [6]
The EU’s cancellation of the €150 de minimis will occur at the earliest in November 2026. Meanwhile, France, Belgium, Luxembourg, and the Netherlands plan to implement a €2 fee per product line (i.e., one or more SKUs) in January. [7]
Germany’s Federal Cartel Office is investigating Temu. “We are pursuing the suspicion that Temu could be setting unacceptable conditions for pricing for traders on the German marketplace.” [8]
Consumer protection organisations in Germany, France, Belgium, and Denmark found that 70% of the tested products purchased on Temu and Shein failed to meet the EU safety standard, and a quarter were considered dangerous. [9]
Last ut not least, EU regulators raided the Temu offices in Ireland as part of a China state subsidy probe. [18]
Latin America
Latin America accounts for nearly half of the emerging markets and is a major driver of Temu's growth. Trade volume in Latin America increased by 70%-80% year over year, close to the global average growth rate. It is showing significant growth potential, although the Brazilian market remains largely untapped. In Brazil, MercadoLibre leads the e-commerce market, followed by Shopee, while Amazon, Shein, and Temu are in the third tier. After 2027, as competition in the cross-border e-commerce market intensifies, Temu expects that some platforms will exit the market, leading to changes in the market structure and potentially increasing sellers’ willingness to advertise.
South American tariff policies have undergone significant changes in the past two years, with Brazil and Mexico being prime examples. Brazil levies a 10% value tax on all parcels imported from China, plus a 17% intrastate transit tax. The Brazilian government uses these tax measures to balance competition between local businesses and cross-border e-commerce while combating tax evasion through low-priced parcels. However, this has also led many Chinese sellers in the Brazilian market to face back taxes and disputes.
While Brazil’s tax system is complex, some companies have successfully reduced their tax burden by partnering with Chinese joint-venture agents. Companies set up local entities in Brazil and ship goods via overseas warehouses, a legal way to avoid taxes and circumvent import duties of up to 60%.
In terms of visit volume, Temu surpassed Shopee for the first time in April, with a 9.9% market share, becoming the second-largest traffic platform after Mercado Libre. [10] In July 2025, Temu became Brazil’s most-visited e-commerce platform, with 410 million visits, overtaking Mercado Libre, according to market research firm Conversion. [11] In October, Temu announced it would open its platform to local merchants in Brazil. [12]
Temu has set aggressive growth targets in the Brazilian market, aiming to increase daily GMV to $10 million. This would bring its annual GMV to $3.6 billion, approaching the annual transaction volume of platforms in several mature markets. To achieve this goal, Temu is reportedly prioritising Brazil’s development and redeploying resources from other Latin American markets, such as Chile and Mexico. [10]
Southeast Asia
While new national markets in regions like Africa and Southeast Asia may be explored in the future, growth currently faces significant challenges.
By August, Temu exceeded 22 million monthly active users in Southeast Asia, one step away from Shein’s 24 million. The annual growth rate of users is 87%, with the Philippines and Thailand exceeding 100%, contributing 86% of the region's traffic. [13]
In the Philippines, Shopee and Lazada have long held a dominant position, with a combined market share exceeding 60%. However, the average price of goods on Temu is 30%-50% lower than on Shopee, making it especially attractive to young consumers (58% of the population under 30), who are price-sensitive. Temu’s gamified shopping experience, drawing on Pinduoduo’s social media platform experience, is another key factor in its success among Southeast Asian youth. [13]
The Indonesian and Vietnamese markets, the most strategically valuable for Southeast Asian e-commerce with populations of 270 million and 100 million, respectively, have not yet been fully opened. Indonesia, the region’s largest market, has imposed restrictions on cross-border small-parcel shipments. These measures require most goods to be distributed through local businesses and forward warehouses to protect domestic trade interests and increase tax revenue. Since entering the Southeast Asian market, Temu’s registration applications in Indonesia have been rejected several times. Last year, the Indonesian Ministry of Trade even forced Apple and Google App Stores to remove the Temu application from their app stores. [13]
There were rumours that Temu would try to ‘do a TikTok + Tokopedia’ and acquire Bukalapak, a local Indonesian e-commerce platform. However, Temu quickly denied the rumour. Bukalapak has since shut down its e-commerce operations, making Temu’s entry into Indonesia even more challenging. Competition in Indonesia’s local e-commerce market has also become fierce. TikTok Shop has become much stronger after its merger with Tokopedia. Shopee and Lazada have been operating in the market for many years. Temu needs to find a breakthrough in differentiation. [13]
In December last year, due to the failure to obtain a registration license from the Vietnamese Ministry of Industry and Trade as scheduled, platforms such as Temu were forced to suspend operations in Vietnam. Vietnamese authorities are reviewing relevant qualifications and plan to issue operating licenses to foreign e-commerce platforms. However, even with the approval, Temu still faces challenges in Vietnam. This year, the Vietnamese government introduced new regulations that eliminated tariff exemptions for small parcels valued at less than 1 million Vietnamese dong (about $40). Meanwhile, Shopee and TikTok Shop have become dominant forces, collectively holding 97% of the market in Vietnam. [13]
Operating models
USA
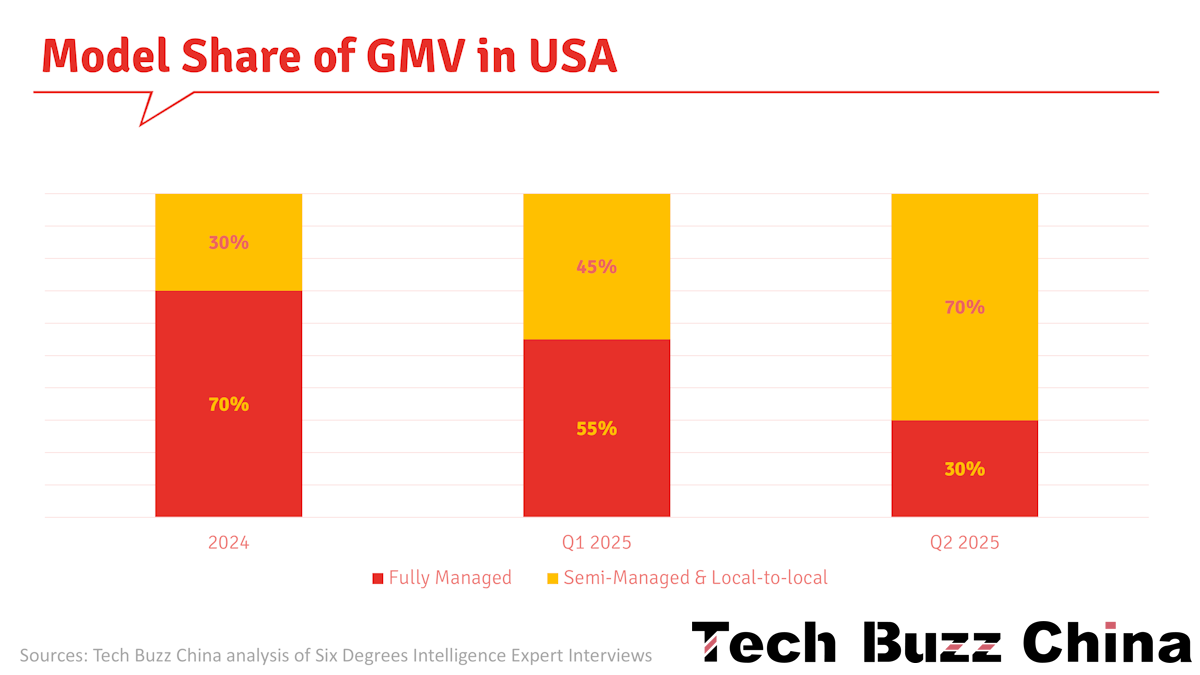
In 2024, Temu primarily employed a fully managed model, which accounted for 70% of its annual business. However, by early 2025, Temu’s business structure had undergone significant changes. In the first quarter of 2025, the proportion of fully managed business dropped to approximately 55%. This downward trend continued through the end of the second quarter, with the share of fully managed business further declining to below 30%. This proportion was expected to continue to fall by the end of the third quarter of 2025.
The significant reduction in fully managed business since the second quarter of 2025 is primarily due to tariff policies. Under the fully managed model, cross-border parcels are subject to a 54% tariff or a $100 flat fee, whichever the carrier applies. Because many parcels with an average order value of $40 cannot afford such high tariffs, the platform has been forced to adjust its operating strategy. Notably, by June 2025, the proportion of fully managed business in the US market had fallen to 20%-30%.
However, Temu adjusted its supply chain by storing best-selling products centrally in U.S. warehouses for each category (the forward-warehouse model). The platform selects the top 50% of best-selling items for inventory, which account for approximately 40% to 50% of total fully managed sales. These measures aim to optimise operational efficiency, reduce costs, and boost merchant confidence.
In the semi-managed model, merchants are responsible for shipping their products to overseas warehouses and for last-mile delivery. Temu’s semi-managed business grew in April and May 2025. However, this model also brought some challenges. New merchants were hesitant about the semi-managed model, so semi-managed goods could not fully replace fully managed goods. Merchants were concerned that, under this model, goods might become unsellable or they would be forced to lower prices, making it challenging to manage overseas inventory. The semi-managed model has been primarily successful among merchants with overseas inventory, such as those selling goods on Amazon.
Temu’s use of forward warehouses in the fully managed model is a temporary measure to provide alternatives for items temporarily unavailable in the semi-managed model, while avoiding the high tariffs associated with cross-border direct shipping. The selected items have been market-tested, are bestsellers with strong sales prospects, and are unlikely to cause significant inventory backlogs. In this way, the platform indirectly protects merchants. At the same time, the goods appear to be supplied domestically by the merchants, but they are actually shipped from Temu's US warehouse for delivery.
Although the volume of semi-managed services has increased, it has not fully offset the decline in fully managed services, which fell 25%-30 % due to a 25%-30% decline in total sales. The growth of semi-managed services stems from increased traffic allocation and expanded merchant inventory, while fully managed services, due to insufficient preparation, failed to adjust their strategies in time. Although the US market has some growth potential this year, sales pressure remains, and the expected increase is limited and unlikely to offset the prior decline fully.
After the de minimis cancellation, direct parcel shipping is primarily used for product testing because it carries lower risk and is suitable for small-scale trials.
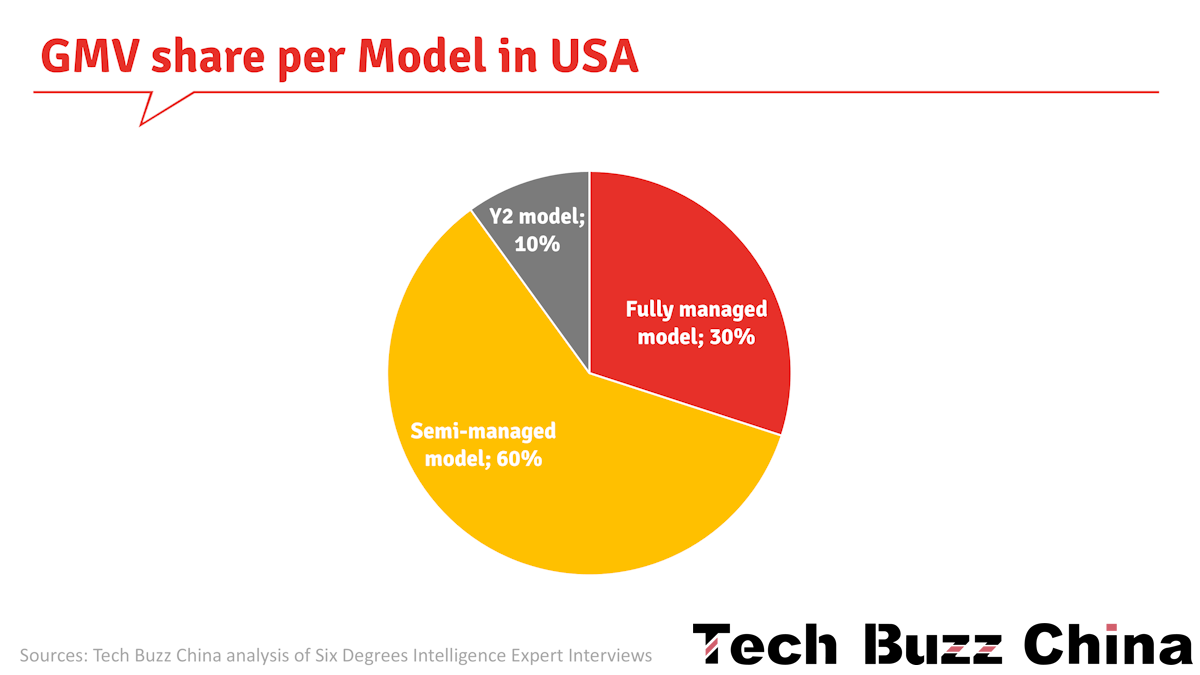
In conclusion, three main operating models currently exist in the US market:
Fully managed + forward warehouses (the platform-managed overseas warehouse and delivery model): it has a low share of transaction volume, but given its focus on best-selling products, this percentage is expected to rise to approximately 30%.
The traditional semi-managed model still dominates, accounting for 50%-60% of transaction volume. The scale of the semi-managed model has stabilised, with no significant growth. Furthermore, the performance of semi-managed models in selling best-selling products cannot completely replace the advantages of fully managed models.
The upgraded Y2 semi-managed model (see below) accounts for a relatively small share of transaction volume, at less than 10%.
Over time, the platform’s transformation has yielded results, and merchants have begun to adopt semi-managed and fully managed operating models, which have optimised and adjusted logistics delivery times.
Globally
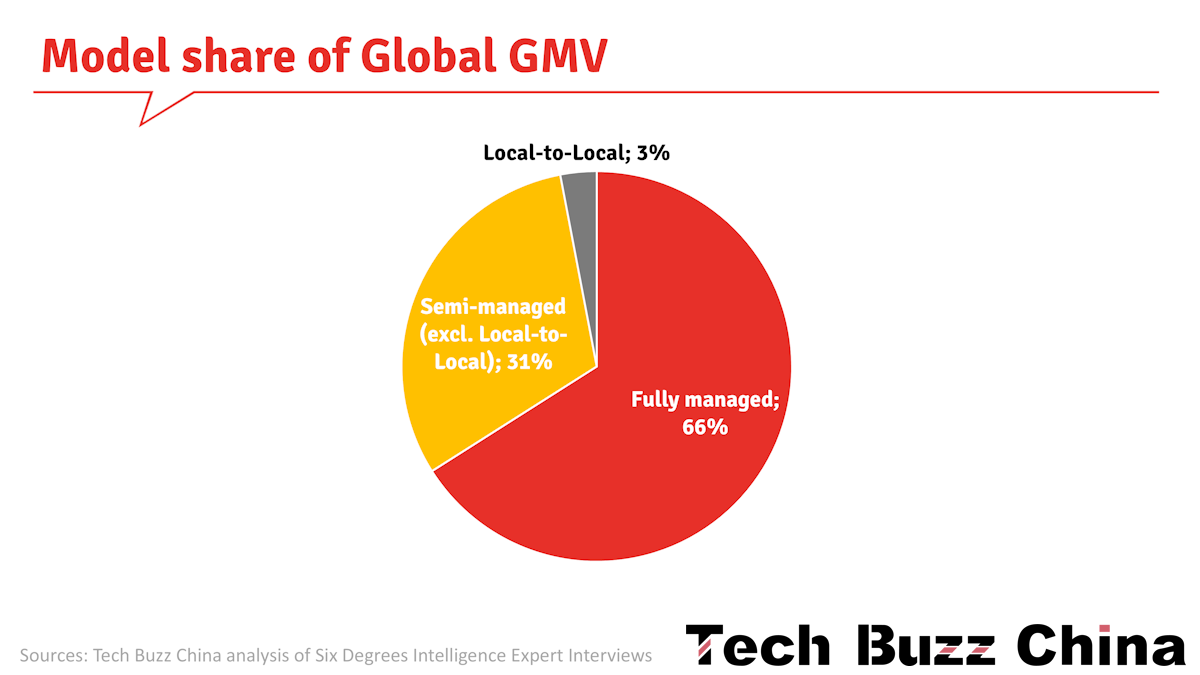
From a global market perspective, fully managed services account for 66% of transaction volume, while semi-managed services account for 34%. The US and Europe have a higher proportion of semi-managed services. Specifically, in the US market, semi-managed services account for 38% of transaction volume; in Europe, this figure is 27%, but note that this service is only offered in certain countries. In contrast, the proportion of semi-managed services is relatively low in regions such as Latin America, Southeast Asia, the Middle East, Australia, New Zealand, Japan, and South Korea.
The local merchant direct-operation model (local-to-local) is now categorised as a semi-managed service and is available only in leading markets, including the US, Europe, and Latin America. Specifically, under this model, in the US market, it accounts for approximately 6% of transaction volume, while in other countries, it generally accounts for less than 5%. Globally, the local direct-operation model accounts for less than 3% of transaction volume.
In the European market, Temu observed the gradual development of the semi-managed model, which currently accounts for approximately 30% of total sales. This model’s success in the European market is primarily driven by anticipated import taxes on small parcels and by well-established logistics and warehousing systems.
Still, semi-managed services (including local-to-local) are not yet available in some European countries, primarily due to two reasons. First, recruiting merchants and building supply chains present significant challenges. Some smaller countries lack sufficient local merchants to support the operational needs of a semi-managed model. Second, regulatory compliance and logistics pose substantial challenges, including customs clearance, transportation, and taxation. Chinese sellers in these regions must manage these aspects independently, resulting in high operational complexity. In contrast, a fully managed model enables pan-European operations, such as transshipping goods from neighbouring countries rather than shipping them directly to the consumer’s country.
It is projected that by the end of 2025, Temu’s fully managed model will maintain approximately 60% share of global GMV, while the semi-managed model will account for approximately 40%. The business structure in the US and Europe is expected to evolve towards a roughly 50/50 split between fully managed (including forward warehouses) and semi-managed services (including local-to-local). However, achieving this goal within the year is unlikely.
Y2 Model
Merchants have several significant concerns about the semi-managed model. First, they worry that they might lose control over goods overseas, increasing risk. Second, price fluctuations on the platform may introduce instability, which also makes merchants uneasy. These concerns may reduce merchants’ enthusiasm for participating in the semi-managed model, making recruitment more difficult. To address this challenge, Temu adopted a semi-managed Y2 model. This model, an improved version of the semi-managed model, allows merchants to ship directly from China to the platform’s warehouses, with the platform handling the final delivery (see our Temu Watch #8 report).
In the Y2 model, merchants may choose their own logistics providers to ship goods from China to U.S. warehouses or transfer stations, with Temu handling local pickup and final-mile delivery. Orders are shipped only after placement, eliminating the need for pre-stocking and reducing the financial risk of unsold inventory. [14]
The Y2 model is characterised by goods not passing through warehousing, but instead clearing customs and proceeding directly to the final delivery stage. The Y2 model allows merchants to conduct product testing and alleviate inventory pressure, but its transaction volume remains relatively low. Merchants choosing the Y2 model may face challenges in forecasting inventory, which could lead to inventory backlogs. Furthermore, merchants may face financial difficulties when preparing inventory due to tied-up capital and poor sales. While this model offers certain advantages for product testing and inventory control, it also brings potential risks and challenges. However, in some cases, it is possible to produce goods only after the order(s) have been received and thereby keep a low domestic inventory.
The Y2 model has pros and cons for different stakeholders:
For merchants: Y2 gives a lower-cost, lower-risk entry path, especially suitable for small-volume items, test products, or businesses unwilling to invest in overseas warehousing. It also forces more responsibility on them (logistics, customs, timing).
For consumers, it may mean lower prices (compared with traditional high-margin overseas-warehouse models), but likely longer delivery times and more variability.
For Temu as a platform: Y2 helps it adapt to more burdensome global trade regulations while still offering low-priced goods, albeit with a more distributed, risk-sharing logistics architecture.
At Tech Buzz China, we have read conflicting information about the Y2 model. One expert claimed it was introduced as a transitional solution due to poor merchant recruitment results and was discontinued entirely after August 29th. Another expert claimed the Y2 plan ultimately failed to be implemented due to changes in tariff policy. Most likely, Y2 was scaled back in the US, but it is still operational, as Temu is rolling it out across 27 European countries (excluding the UK). Merchants have 8-12 days to prepare orders and 3-9 days to deliver goods, resulting in a total delivery time of up to 21 days. [15]
Compared with the Y2 model on the U.S. site, the EU version offers more flexible rules. It permits the use of non-platform shipping labels and third-party overseas warehouses if sellers hold a valid VAT registration number in the country of dispatch. This significantly reduces overseas inventory pressure and the risk of unsold stock, supports lighter-asset operations, and enables more agile product testing for sellers. [16]
Logistics
Temu’s international profitability strategy includes reducing fully managed service fees, building a cross-regional logistics system, and experimenting with local delivery methods. The company is expanding its overseas warehousing capacity to reduce its reliance on high-cost cross-border direct mail. In Q3 in the US market, approximately 50%-60% of goods were shipped directly from China, while 40%-50% were supplied through overseas warehouses. To optimise its logistics network and reduce costs, Temu relies primarily on ocean freight to replenish its overseas inventory, as ocean freight costs are only one-fifth of air freight ($15 for express air freight and $3-4 for ocean freight). By cleverly combining ocean and air freight, Temu has reduced its overall logistics costs to under $10/kg, significantly improving operational efficiency.
By October, the distribution of cargo transport in Europe was as follows: 35% of goods are transported by air (fully managed), 45% by sea or rail express (fully managed), and the remaining 20% are semi-managed. The cost of rail express is almost the same as sea freight.
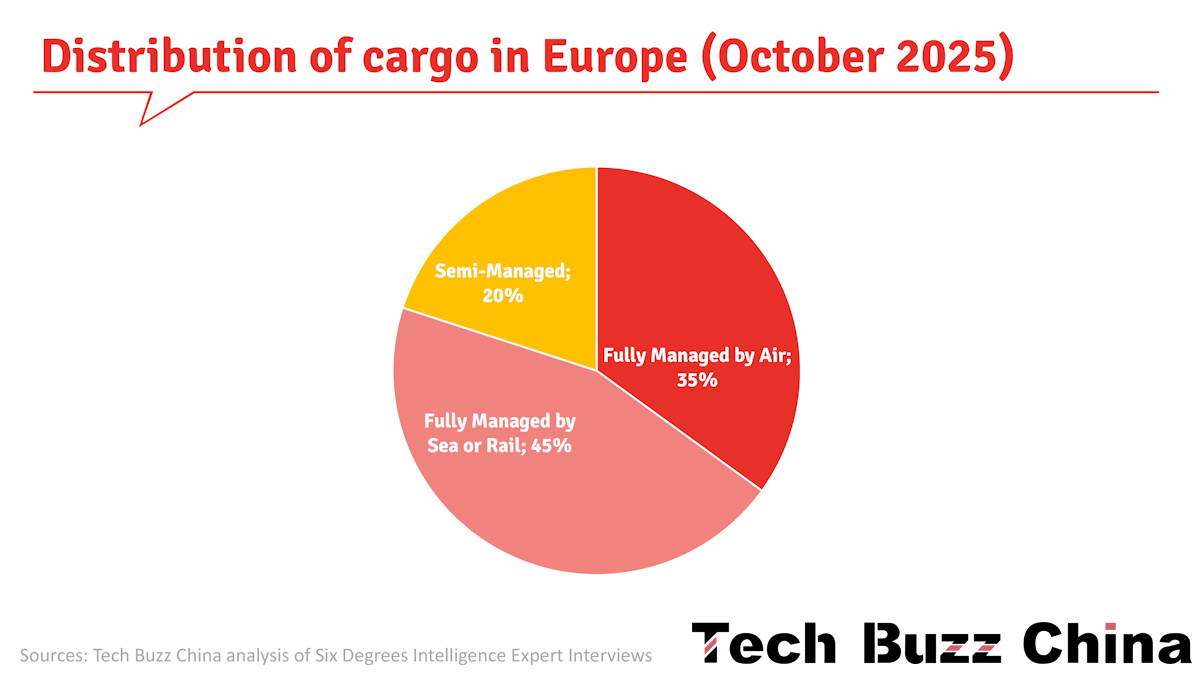
Note: Fully Managed by Air refers to direct-to-consumer packages. Fully Managed by Sea or Rail refers to stocking forward warehouses in bulk. Semi-managed shipments are those from local warehouses by merchants, most likely replenished via sea freight.
In Europe, combinations of transport modes are common. For example, a China-Europe express shipment might be transferred to air transport after arriving in Europe by rail, or to other modes after arriving by sea. In Temu’s fully managed services, the loss rate for air transport is 8%, while for non-air transport it is 2%.
Intercontinental Transport Costs
In the fulfilment costs of fully managed services, the key lies in increasing the proportion of sea freight and reducing the proportion of air freight. In the past, air transport was the primary source, accounting for 20% to 30% of annual fulfilment costs. Currently, the proportion of integrated transport and sea freight has increased. Sea freight has shifted from relying primarily on slow vessels to a mix of fast and slow vessels, with a focus on fast vessels.
The cost of slow sea freight is approximately one-sixth of that of air freight, accounting for 4% of the total cost, while the cost of fast sea freight accounts for 17% of the total cost. The most significant decrease in fulfilment costs is due to the increased proportion of sea freight.
The following section describes China's logistics in general, not specifically Temu’s operations.
Shipping container costs from China to the United States fluctuated significantly in 2024 and 2025. In 2024, the price of a standard container rose from over $3,000 to over $4,000. However, the price volatility was even more pronounced in 2025. Starting in mid-May, costs surged from $3,600 to nearly $7,000, almost doubling. This sharp increase was mainly due to exporters booking bulk cargo space and US businesses stockpiling goods in response to market changes. However, by August, prices had fallen slightly, with standard container prices ranging from $5,000 to $5,800.
Looking ahead, export activity is not expected to be directly affected by tariffs, given holiday restocking demand and the extension of US tariffs to November 12, 2025. Temu anticipated prices would rise by approximately 10% from the current level of over $5,000 in late September, potentially returning to $6,000. This forecast accounts for seasonal factors and market dynamics.
Europe widely utilises the China-Europe rail transport, which is approximately 5-10% cheaper than sea freight. Specifically, sea freight to Europe costs RMB 7 - 11 per kilogram, while the lowest cost for China-Europe rail transport can reach RMB 6 per kilogram. Although the final delivery cost increases by 5-10%, the reduction in initial transportation costs mitigates some of the impact.
However, the sea freight situation changed in the first half of 2025. Due to factors such as the rerouting of the Red Sea route, sea freight costs for the European route increased by approximately 15% in the first and second quarters. Consequently, the overall logistics cost proportion for the European route increased from less than 20% to nearly 25%. Overall, logistics costs for the European route remain relatively stable, accounting for approximately 25% of total costs with minimal fluctuations.
Warehouses
By October 2025, Temu operated 13 self-owned warehouses globally, including 10 in Europe, 2 in the United States (on the east and west coasts, totalling 150,000 square meters), and one near the US-Mexico border (a 120,000-square-meter “Jitu Warehouse US-Mexico”). Temu sends returned goods to its US-Mexico Jitu warehouses, where they are repackaged and resold to reduce losses. Notably, the 14th self-owned warehouse project will be located in Rio de Janeiro, Brazil, and plans also include a new warehouse in Thailand. Vietnam once had a warehouse facility covering 120,000 square meters, but it is now out of use.
Temu restructured its organisation in October 2024 and subsequently began building its own warehouse facilities in the United States. Temu’s global warehousing and logistics strategy focuses on strengthening its infrastructure and establishing a mature operational system, which are key to achieving profitability. It is rumoured that by the end of 2025, Temu may increase its number of self-operated warehouses in the US to five. Still, the company has not yet indicated plans for a large-scale expansion of its self-operated warehousing.
These self-operated warehouses primarily serve as a business buffer and for replenishing goods, but Temu’s overall delivery still relies on third-party warehousing. The primary function of the self-operated warehouses is to store some of the fully managed best-selling products (forward warehouses) and provide initial support for newly joined semi-managed merchants. It is projected that by 2025, Temu’s self-operated warehouses in the US will handle 15% to 20% of total US goods volume, and this proportion may increase to 20% to 25% by 2026.
In the US market, self-operated warehousing will not become the primary delivery method. Still, it will attract new merchants by providing support such as traffic weighting, offering initial assurance, and reducing merchant concerns. However, self-operated warehouses also incur unavoidable expenses, including warehouse rental fees, shelving purchases, and employee hiring.
In addition to self-operated warehouses, Temu has nearly 20 officially certified service warehouses in the US, along with numerous uncertified storage facilities. These facilities are primarily located in five key regions: the East, West, Midwest, the Great Lakes region of Canada, and South Florida. The most important warehouses are located on the East Coast, West Coast, and South Texas. Through partnerships with official and certified warehouses, Temu achieves an average local delivery time of slightly over 3 days in most parts of the US, excluding non-continental regions such as Hawaii and Alaska. Despite challenges to Temu’s GMV growth, the company is actively expanding its official warehouse network.
Merchants’ semi-managed goods are typically stored in third-party or in-house warehouses. In the US, third-party warehousing networks span more than a dozen key regions, including major overseas logistics service providers and specialised service providers in categories such as outdoor furniture. The advantage of third-party warehouses is their ability to handle a wide variety of products and to enable small and medium-sized merchants to manage inventory flexibly. This flexibility is crucial for diverse product structures and merchants of different sizes.
Self-operated and third-party warehouses differ significantly in their operating methods and cost structures. Self-operated warehouses can establish close relationships with major merchants or best-selling products, ensuring the sales stability of high-weight items, with sell-through rates sometimes exceeding 95%. Furthermore, self-operated warehouses provide a buffer for the platform, reducing the uncertainty caused by fluctuations in third-party warehouse shipments. In contrast, merchants using external warehouses pay only a basic fee based on storage space or delivery volume, providing greater cost flexibility. As the business expands, the initial investment in renovations and equipment for self-operated warehouses will be gradually amortised.
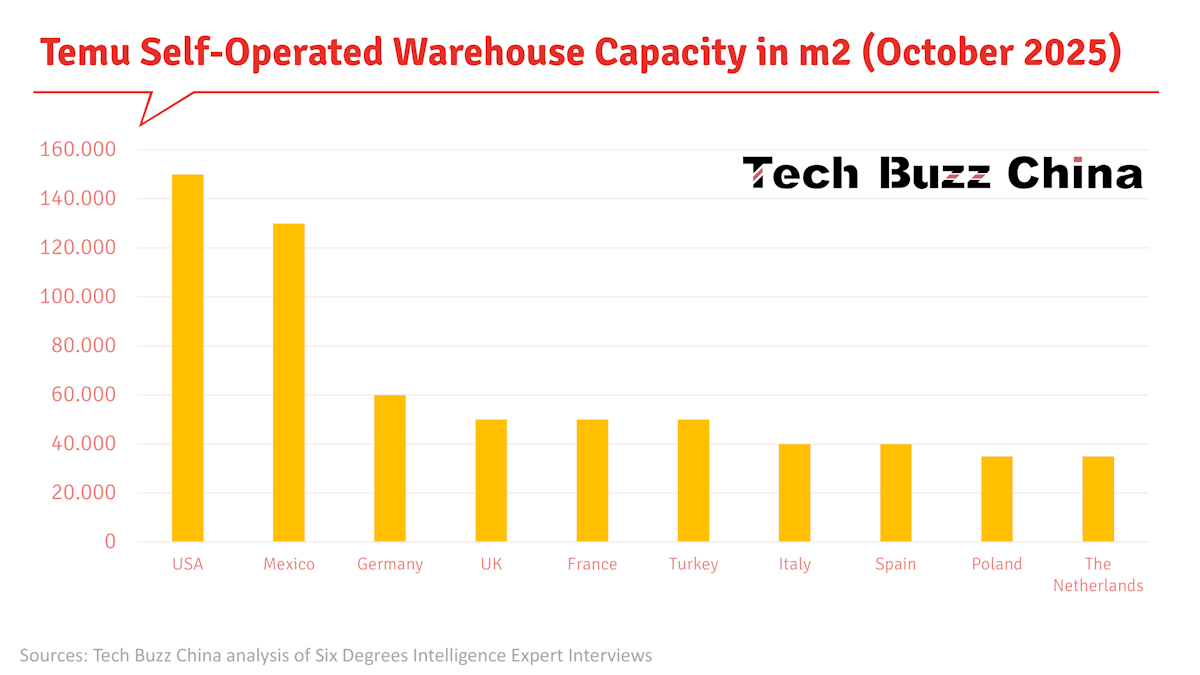
In Europe, Temu has established its own warehouses in eight countries: the UK, Germany, France, Italy, Spain, the Netherlands, Poland, and Turkey, covering 50% of the region. Another expert claimed it also had a warehouse in Hungary.
Europe’s transportation system is also highly developed, with the Central European Railway and traditional sea routes (primarily through the Netherlands) significantly improving logistics efficiency. In contrast, US sea freight routes are longer, with goods typically arriving at ports such as Long Beach or Los Angeles on the West Coast before transhipment to the East Coast, which can reduce operational efficiency. By the end of 2025, Temu expects its self-operated warehouses to handle over 30% of its cargo in the European market, potentially reaching 40% in key regions like the Netherlands, Germany, and Spain.
Compared to the US, Europe has a more comprehensive network of forward warehouses, and the lower transportation costs of the China-Europe Railway Express enable next-day delivery to neighbouring regions. Platform-leased and operated forward warehouses can increase traffic ranking, but inventory flexibility is limited. Ownership of the goods remains with the merchant. In contrast, third-party overseas warehouses, where merchants manage their own inventory, offer greater flexibility, allowing unsold goods to be transferred to other channels, such as Amazon or independent websites, for sale. Meanwhile, forward warehouses, due to inventory lock-in, may limit this flexibility.
In terms of investment costs, the construction cost of each self-owned warehouse, including machinery and software, is approximately RMB 100 million (~$14 million).
The 10 self-owned warehouses in Europe have an average floor area of 70,000 to 80,000 square meters, although the actual usable area is currently close to 50,000 square meters. Further breaking down the European self-owned warehouse layout, Germany has 3 warehouses (including one in Frankfurt) with a total area of approximately 50,000 to 60,000 square meters; the UK, France (Paris), and Turkey each have 50,000 square meters; Italy and Spain each have 40,000 square meters; and Poland and the Netherlands each have 35,000 square meters.
In its strategic layout in the European market, Germany was designated as the operations centre, with three self-operated warehouses established as central hubs for the pan-European route. Goods arrive at German air and port facilities and are then transshipped via the pan-European route to other European countries, such as Luxembourg. The primary targets are concentrated in five key countries: the UK, Germany, France, Italy, and Spain. The Frankfurt warehouse was initially used as an airport warehouse, while the Paris warehouse is one of its main facilities. The Polish warehouse primarily handles end-to-end logistics for rail transport across Central and Eastern Europe.
Warehousing operations in the Netherlands mainly rely on the Port of Rotterdam for maritime transport and logistics. These European warehouses can be flexibly deployed and rotated between different regions, with the two central warehouses in Germany and Poland handling over 600,000 orders daily. Given the proximity of European countries, this warehousing network significantly reduces delivery times compared to direct mail, thereby improving Temu’s operational and logistical efficiency in the European market.
In other regions, the self-owned warehouse near the US-Mexico border covers approximately 120,000-130,000 square meters. In comparison, the two self-owned warehouses in the United States each have an area of 70,000 to 80,000 square meters. From an operational efficiency perspective, warehouse facilities in Europe and the United States are not yet fully operational, with currently operational areas of 50,000 to 60,000 square meters and 70,000 to 80,000 square meters, respectively.
Since implementing self-operated warehousing, delivery efficiency has significantly improved. For example, in Mexico, delivery time has been reduced by an average of 1 to 5 business days. Simultaneously, the variety and quantity of goods in overseas inventory have increased, and delivery times for packages to the US or Europe have shortened from 8 to 12 business days, respectively.
Merchant’s risk assessment
Cross-border e-commerce merchants face a significant challenge in inventory management. Currently, cross-border e-commerce platforms haven’t introduced a warehouse distribution function similar to Amazon’s, meaning sellers must decide the quantity of overseas inventory themselves. This decision is particularly critical because excessive inventory in the final stages of product sales can lead to price reductions or even losses.
The characteristics of different platforms also influence inventory management strategies. For example, on Amazon, some long-tail products can have sales cycles lasting 24 to 36 months, or even longer. In contrast, Temu adopts a rapid update strategy with shorter product lifecycles, meaning excessive inventory on Temu can increase risk. Merchants relying on a single sales channel face even greater inventory management risks. Therefore, cross-border e-commerce sellers need to develop flexible inventory management strategies tailored to platform characteristics and product lifecycles to balance sufficient supply with the avoidance of inventory backlogs.
Local logistical costs
In terms of cost control, the self-operated warehousing model has significantly reduced shipping costs for a single order to the US, from $15 for cross-border direct mail to approximately $8, a nearly 45% reduction. Furthermore, significant progress has been made in service quality, with the delivery success rate for self-operated warehousing increasing from 90% to 93%-95%.
Currently, US operations are slightly unprofitable, but profitability is expected once the two self-built warehouses are fully operational and the expenditure structure stabilises. Once warehouse operations are stable, the handling cost per item is expected to be controlled between $0.50 and $0.60. After deducting delivery and warehouse handling costs, the remainder will become profit.
Building your own warehouse is a good strategy to reduce reverse logistics costs. Third-party warehousing operations are more expensive than forward logistics for handling returns and involve additional transhipment, unpacking, and repackaging, resulting in higher costs. In the US market, the return rate is approximately 15%. Last-mile delivery costs per order are roughly $3 to $4, with reverse logistics accounting for $1 to $1.20. While processing returns through a third party costs approximately $1.20, handling them through your own warehouse can reduce costs to $0.60, resulting in roughly $0.60 in savings per order.
Last mile & Self-pick up
In the third quarter of 2025, the markup rate in the European market decreased, primarily due to the company’s active promotion of community delivery models, utilising parcel lockers, community outlets, and supermarkets to complete last-mile delivery. To encourage users to choose self-pickup, the company implemented measures to lower product prices.
The fulfilment model has shifted from full-chain outsourcing to segmented contracts for the upstream, midstream, and downstream stages. In the Spanish and Portuguese regions, given their geographic proximity, a decision was made to partner with the same logistics company. Furthermore, a pilot project was launched in Europe, in collaboration with qualified last-mile delivery service providers, to integrate customs clearance and delivery processes. These changes in the operating cost structure have improved overall profitability by reducing last-mile delivery costs and optimising the logistics network layout.
Staffing
Temu is now prioritising compliance and focusing on long-term, localised business in more countries. In August of this year, Temu asked some employees to relocate from its Shenzhen headquarters, which houses its cross-border business, back to Pinduoduo’s headquarters in Shanghai, signalling the end of its rapid overseas expansion. [17]
During the same period, Temu began sending nearly a thousand employees to overseas markets in the third quarter. Most of these employees will work in core markets in Europe and the United States to promote logistics optimisation, merchant expansion, compliance, and related initiatives. This is the largest overseas deployment since Temu's founding and will continue into the fourth quarter. [17]
A headhunter told Latepost that, to recruit professionals more familiar with overseas laws and regulations than platforms like Shein, core managers often conduct in-person interviews and even visit candidates in their cities. Meanwhile, its competitors usually rely solely on HR managers for recruitment. [17]
The (lack of?) impact of tariffs
Tax rate changes have significantly impacted China’s cross-border e-commerce exports. The tax rate changes mean that fully managed goods are subject to an import tax of 54% of the retail price (DTC packages) or 30% of the wholesale value (bulk imports to forward warehouses), greatly diminishing their price advantage.
One expert claimed the following, which we have not been able to verify: “In the US market, the B2B2C model significantly reduces the formal tax rate from 54% to approximately 15%. While a 15% tax burden is still relatively high, a direct 15% price increase would erode market competitiveness. However, by optimising customs procedures, the US can typically further reduce the tax rate by more than half, thereby reducing the tax burden even further. Ultimately, data shows that actual tax payments in the US usually remain between 5% and 8%, keeping overall expenditure within a manageable range.”
Currently, there are three main ways to enter the US market:
Entering a domestic bonded zone through regular trade and then shipping overseas.
Transiting through ASEAN or Southeast Asian countries and then entering the US via Hong Kong or South Korea.
Direct export to the US via the Y2 direct shipping method.
If Chinese exporters ship directly from Guangzhou, they must pay a 30% tariff. However, if they transit through Vietnam, they can avoid higher tariffs, but a certificate of origin is required. Vietnam’s transhipment options offer exporters two ways to optimise logistics and costs, which may help them cope with current tax rate changes.
However, transit trade increases supply chain costs, including transportation, tariffs, and certificate-of-origin fees. For example, a product costing RMB 10 to produce in China might increase in cost by 20% to RMB 12-13.5 after transiting through Vietnam. Furthermore, the cost of certificates of origin has risen from the original 2%-5% to higher levels, further squeezing businesses' profit margins.
Regarding specific coping strategies, e-commerce platforms such as Amazon, Temu, Shein, and TikTok mainly address tax burdens by reducing discounts, typically by 3-5 percentage points, rather than directly raising product prices. However, during periods of high tax rates, Temu adopted a more aggressive strategy for fully managed products, raising prices by 20-50%, with some products increasing by 100-200%.
Meanwhile, sellers have made significant adjustments to their product structure, minimising or eliminating low-priced, unprofitable product lines. Due to market changes, sellers’ product development and R&D teams have been forced to focus on designing and producing higher-margin products to improve profitability.
Chinese sellers have generally readjusted their product mix, abandoning low-priced products. Simultaneously, sellers have begun developing or upgrading mid- to high-end product lines, with these new products priced at least $10 to $20 higher than their predecessors. Previously, items priced at $1.99, $2.99, $3.99, $4.99, or $5.99, such as phone cases and charging cables, offered almost no profit and were mainly used to boost sales and attract customers. Therefore, businesses are no longer relying on low-cost marketing strategies; instead, they are maintaining operations by raising prices or developing high-profit products.
Historically, the quality of Chinese-made goods has been questioned, partly because the business environment at the time allowed companies to compete through low-price strategies without facing policy, regulatory, or tax barriers. However, with the implementation of the current US-China bilateral trade agreement, the tax burden has risen to 30% or even 54%, forcing companies to adjust prices to maintain profit margins, while the underlying competitive landscape remains unchanged. Even after price adjustments, Chinese-made goods still maintain a cost advantage in the US and European markets, particularly in necessities and consumer goods. This price adjustment is widespread, with all retailers raising prices simultaneously. Although consumers pay higher prices, they continue to buy because the price advantage of Chinese-made goods persists.
Next week, in Temu Watch #11, we will take a closer look at developments in Temu’s order values, pricing strategies, GMV, profitability, and more. The report you just read was complimentary; next week’s will be available only to paid supporters.
Key Takeaways & TLDR Video Summery
Here are 10 key takeaways from the Temu Watch 10 report, created with Google Notebook:
Europe has overtaken the US as the primary growth engine. While US growth has stalled due to tariffs, Europe has become Temu’s largest market, accounting for 40% of global sales with year-on-year growth of 80%–100%.
Tariffs forced a radical shift in the US operating model. The cancellation of the US de minimis tax exemption rendered the direct-to-consumer “fully managed” model unviable due to a 54% tax rate. In response, Temu pivoted to a “forward warehouse” strategy (bulk-importing bestsellers to US storage) and a “semi-managed” model, reducing the original fully managed share of the business from 70% to under 30%.
Logistics costs slashed by shift from air to sea. To protect margins, Temu aggressively transitioned from air freight (approx. 3–$4/kg). By optimising this mix, using “fast vessels” for restocking, Temu has reduced overall logistics costs to under $10/kg and lowered per-order handling costs in the US from $15 to $8.
Building a “moat” of self-owned warehouses. Moving beyond an asset-light model, Temu is building physical infrastructure, operating 13 self-owned warehouses globally (10 in Europe, 2 in the US, 1 in Mexico). These facilities buffer inventory, enable lower-cost returns processing (saving ~$0.60 per order), and are essential to the new bulk-import strategy.
Proactive preparation for EU regulatory changes. Anticipating the EU’s removal of the €150 tax-free threshold in 2026, Temu is already expanding its semi-managed and bulk-shipping capabilities. The company is using its German warehouses as a central hub to ensure it is not caught off guard, as it was in the US.
Emerging markets: Brazil is the priority; SE Asia struggles. Temu is redeploying resources from Mexico and Chile to prioritise Brazil, aiming to reach $3.6 billion in annual GMV despite complex tax regulations. Conversely, expansion in Southeast Asia faces a “hard block,” with Indonesia repeatedly rejecting Temu’s registration to protect local trade.
The rise of the “semi-managed” model. Globally, Temu is pushing merchants to assume logistics risk through the “semi-managed” model, which now accounts for 34% of global transaction volume. However, adoption in the US has been slower than expected due to merchants' concerns about unsold inventory liabilities.
The hybrid “Y2” model for risk mitigation. Temu introduced the “Y2 model,” in which merchants ship to domestic transfer stations, and Temu handles final delivery. While it offers a lower-risk entry for merchants than full overseas warehousing, it accounts for less than 10% of transaction volume in the US due to inventory forecasting challenges.
Strategic localisation of workforce. Signalling the end of its “rapid expansion” phase, Temu is relocating headquarters staff from Shenzhen/Shanghai to overseas markets. Nearly 1,000 employees are being deployed to the US and Europe to manage compliance and local merchant acquisition.
End of the “ultra-low price” era. To cope with tariffs and higher compliance costs, merchants have eliminated unprofitable low-cost items (e.g., $1.99 phone cases) and raised prices on other items by 20%–50%. Despite these hikes, Temu remains price-competitive, though the US operation remains slightly unprofitable pending further warehouse optimisation.
The following video summary of this report was created with Google Notebook.
Sources
The information in this report is compiled from exclusive expert interviews within the Six Degrees Intelligence network, augmented with information from the sources below.
[1] 2025-11-20 36Kr [2] 2025-10-29 Visual Capitalist [3] 2025-10-20 Chinesellers [4] 2025-09-16 Chinesellers [5] 2025-10-15 Reuters [6] 2025-11- 20 LCP [7] 2025-12-03 NOS [8] 2025-10-08 DW [9] 2025-10-30 Consumentenbond [10] 2025-08-21 Crossborder Dispatch [11] 2025-08-25 Chwang [12] 2025-10-30 eCommerce Brasil [13] 2025-08-29 派代跨境 [14] Walltech [15] 2025-11-17 Yugou [16] 2025-12-01 Forest Shipping [17] 2025-12-04 Latepost [18] 2025-12-11 Financial Times
Images by Tech Buzz China’s Ed Sander, unless stated otherwise. These images may not be reproduced without Tech Buzz China’s prior consent.