
Temu Watch 11: Profitability arrives?
How Temu adjusts its advertising and pricing strategies to reach profitability.


Contents

Things that caught our attention
Introduction
This month, we are sharing new and updated insights into developments at Temu, sourced from more than 10 expert interviews with people close to the company.
Last week, in Temu Watch #10, we examined the current situation across different markets, the logistical changes the company implemented, and the impact of US tariffs. We made this report free to read for everybody.
This week, in Temu Watch #11, we will take a closer look at developments in Temu’s advertising and pricing strategies, order values, GMV, profitability, and the outlook for 2026 and beyond. This report is only available to paid subscribers.
Become a paying subscriber to unlock the report and support our in-depth research into key China tech trends.
Note: this report is compiled from the insights of 10+ experts. Sometimes their individual claims, especially regarding specific data, conflict to some extent. Instead of removing ambiguous information that still sounds plausible or selecting a single expert, we have left these slightly conflicting claims in the text so readers can weigh them.
Ed Sander, Tech Research Analyst

Advertising Spending
Temu entered the US market in the second half of 2022, initially focusing on extremely low pricing strategies to gain market share rather than relying on advertising. This included offering products priced between $0.01 and $0.99 and providing $200 vouchers to new customers. Subsequently, Temu ran a significant advertising campaign from the first half of 2023 through early 2024, including commercials during Super Bowl broadcasts.
Starting in the third quarter of 2024, Temu adjusted its strategy, focusing its advertising efforts on the European market, achieving positive results and increasing advertising spend year over year. Temu also conducted a market test in Southeast Asia for approximately three months, but after poor results, its advertising spending in the region decreased significantly.
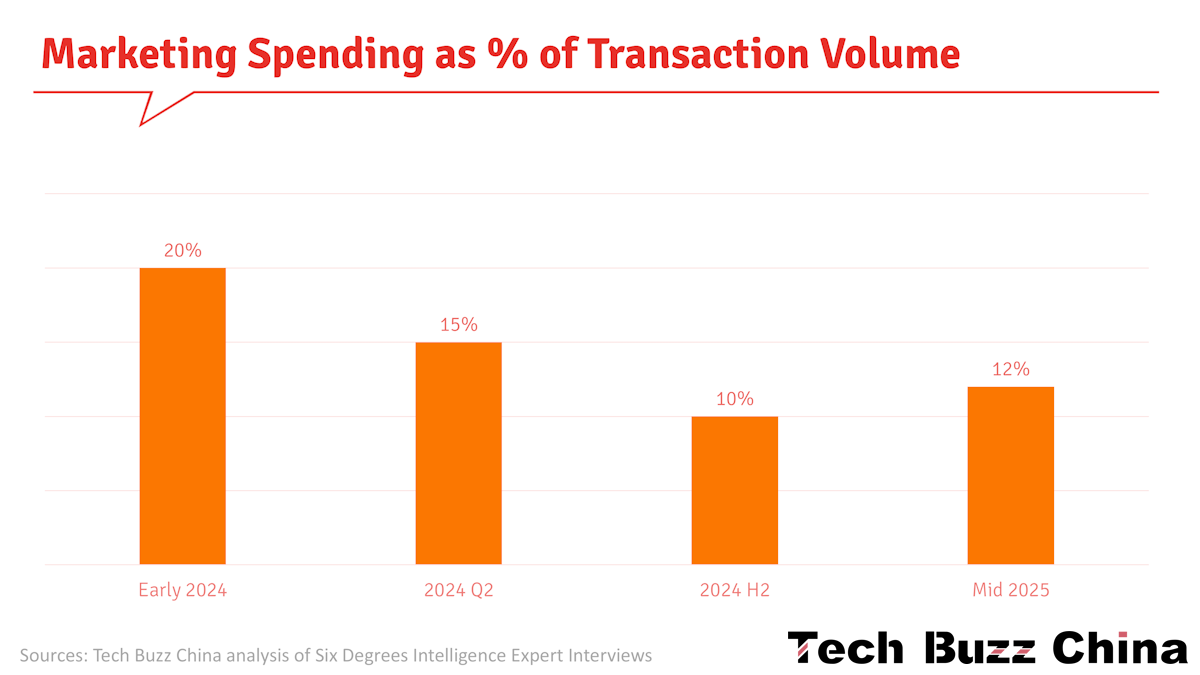
Temu’s marketing expenditure as a percentage of total transaction volume gradually decreased from early 2024 to mid-2025. Specifically, in early 2024, total marketing expenses, including offline and off-platform promotions, exceeded 20%. By the second quarter of 2024, this percentage had dropped to approximately 15%. In the second half of 2024, even during promotional periods, the marketing expenditure percentage remained below 10%.
The situation changed in 2025. In the first quarter, Temu’s advertising spend in key regions, including Europe, accounted for 15%-20%, while the US market was not a primary focus. In the second quarter, advertising spending further decreased due to tariffs and other factors. However, between June and July 2025, Temu significantly increases its advertising efforts in the US market, particularly on Google Search, Meta, and other content platforms. By August, the overall marketing expenditure percentage was approximately 12%. In the long term, this percentage is likely to remain below 10%.
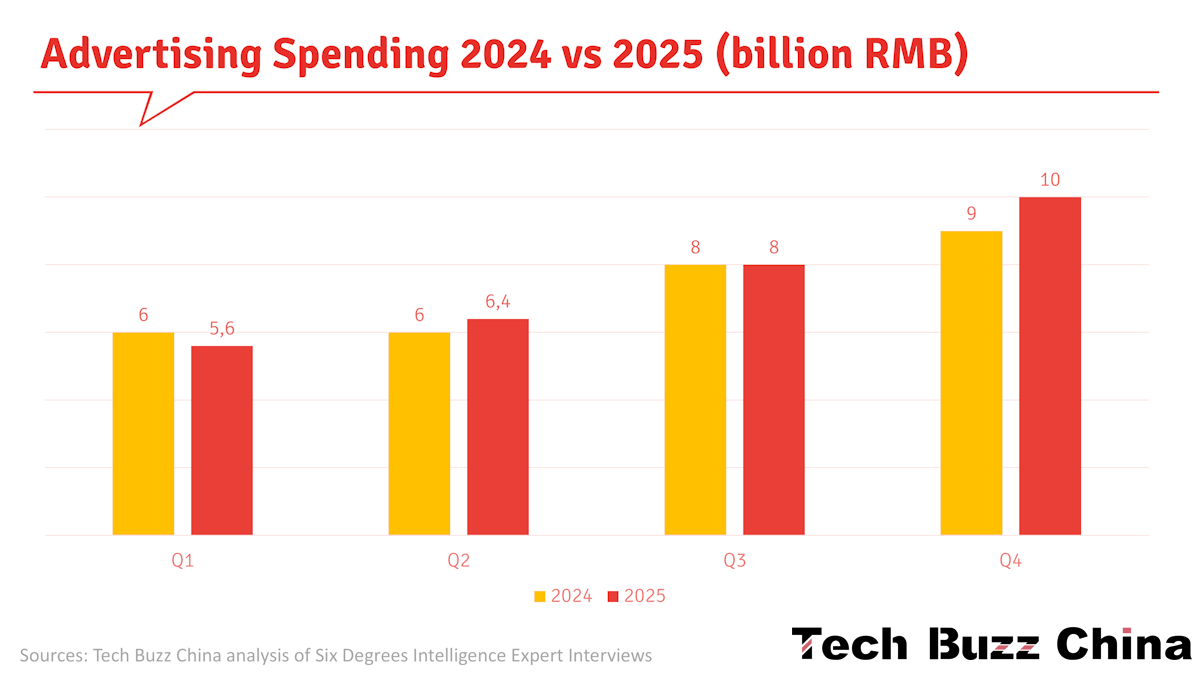
The total advertising budget for 2025 will be between 25 billion and 30 billion RMB (~$3.5-$4.3 billion). Specifically, advertising expenditure was projected at RMB 5.6 billion in the first quarter, increasing to RMB 6.4 billion in the second quarter. The third quarter’s budget was expected to approach RMB 8 billion. Due to the impact of Black Friday promotions, fourth-quarter spending was expected to exceed third-quarter levels, reaching RMB 9-10 billion. In comparison, total advertising spending in 2024 was approximately RMB 30 billion. Spending in the first and second quarters of 2024 was approximately RMB 6 billion, while in the third and fourth quarters it was RMB 8 billion and RMB 9 billion, respectively.
Advertising per region
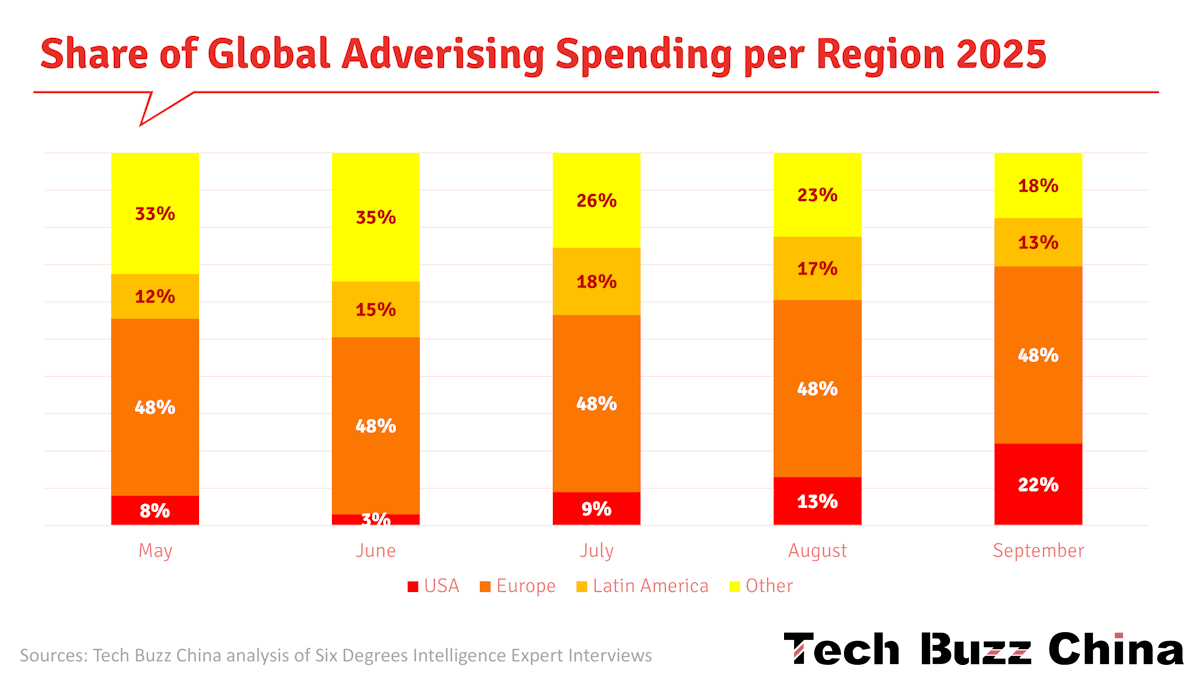
As a result of the cancellation of the de minimis tax exemption, the share of the US in Temu’s advertising spending experienced significant fluctuations, starting with an 8% market share in May, and plummeting to 3% in June. However, in July, as sales recovered, the US region increased its advertising spending again, gradually recovering to 9% in July, 13% in August, and a substantial increase to 22% in September.
While US regional advertising spending rebounded after July, its intensity and coverage were lower than last year, reaching only 60%-70% in the same period. The third quarter was a recovery phase, and significant investment was necessary in the US region to achieve a rapid recovery. However, due to concerns about tariffs, Temu has decided to suspend the launch of new creative ads in the US market starting October 13th, retaining only existing high-performing creatives.
Meanwhile, its spending in the European market remained relatively stable, averaging 45%-50% from May to September. Temu’s approach to advertising in Europe aligns with its global strategy. It has country heads in each market and has established a localised advertising team in the US, with advertising decisions made by these country heads.
In Latin America, the share of global spending rose from 12% in May to 15% in June, then to 18% in July, 17% in August, and finally to 13% in September. This change was mainly due to fluctuations in traffic in Mexico. In North Africa, the spending share remained relatively stable at 8%-10%, with only a slight decrease in August.
Temu’s spending in Japan, South Korea, Southeast Asia, Australia, New Zealand, and the Middle East was relatively stable, but in September, due to logistical issues and the local political environment, the Middle East's share declined from 8% in August to 4%.
From an advertising investment perspective, November advertising spending was expected to reach its highest level of the year, driven by promotional activity. Temu’s total advertising expenditure in November was projected to reach $500 million, and the US share of global spending is likely to continue rising if tax policies remain unchanged.
Temu’s primary target markets are expected to be concentrated in the US and Europe, with the US accounting for 30% and Europe for 50% of its total advertising spend. Meanwhile, Temu’s advertising spending in Latin America and Africa is projected to account for 10%-15%. However, performance during promotional campaigns in the Middle East, Japan, South Korea, and Southeast Asia has been poor. Its share is also low due to the smaller market size in Australia and New Zealand.
Temu faces significant structural limitations in its funding model. Fund transfers between regions are relatively slow; funds saved in one region are typically not directly transferred to others. Instead, a biweekly request-and-approval process is used for allocation. This operational model directly leads to substantial differences in budget allocation across regions.
Advertising strategy
Temu strictly adheres to a 40% ROI standard across all scenarios involving new user acquisition and existing user activation. Failure to meet this standard will trigger a circuit breaker, requiring accounts to undergo a complex approval process before reactivation. Particularly in the US, this 40% ROI standard is strictly followed, with recovery employing a gradual strategy, typically on a weekly or city-by-city basis, prioritising expansion from major paying cities like California and Texas to the rest of the country.
In Europe, the competitive focus has shifted to strategic service content, such as return and exchange policies, tax processing, and quality assurance. Temu’s promotion in the European market focuses on general merchandise, emphasising price advantages and coupons. Across advertising channels, Google outperforms Meta when ad spend is increased, primarily due to cost factors. Since Meta’s ad spending is already quite large, further increases are costly, thus its ad spending remains relatively stable.
Temu saw improved ROI during the summer sales season in Q3 2025. Google’s advertising data showed a positive trend in 2025, with Temu’s account performance improving as well.
Strategically, Temu plans to increase advertising spending on major performance media platforms such as Meta, Google, and TikTok, while reducing investment in programmatic and brand advertising. The main reason for this adjustment is the low ROI on some platforms; for example, Applovin's ROI is below the 40% threshold. In fact, Temu’s prior investment in programmatic advertising platforms was primarily for experimentation, and it is no longer willing to continue such testing.
Specifically, on the Applovin platform, Temu has a CPM of 2.7. Higher click-through rates characterise Applovin, and it uses a views-based attribution model. For example, if a user sees an ad on Applovin, clicks, and then completes a purchase on Meta, Meta records a conversion, while Applovin counts it as a secondary conversion. Investing more in Applovin leads to more impressions and better-looking performance data on the platform, but this doesn’t necessarily translate into improved results; it simply means an increase in auxiliary conversions.
AOV and Pricing
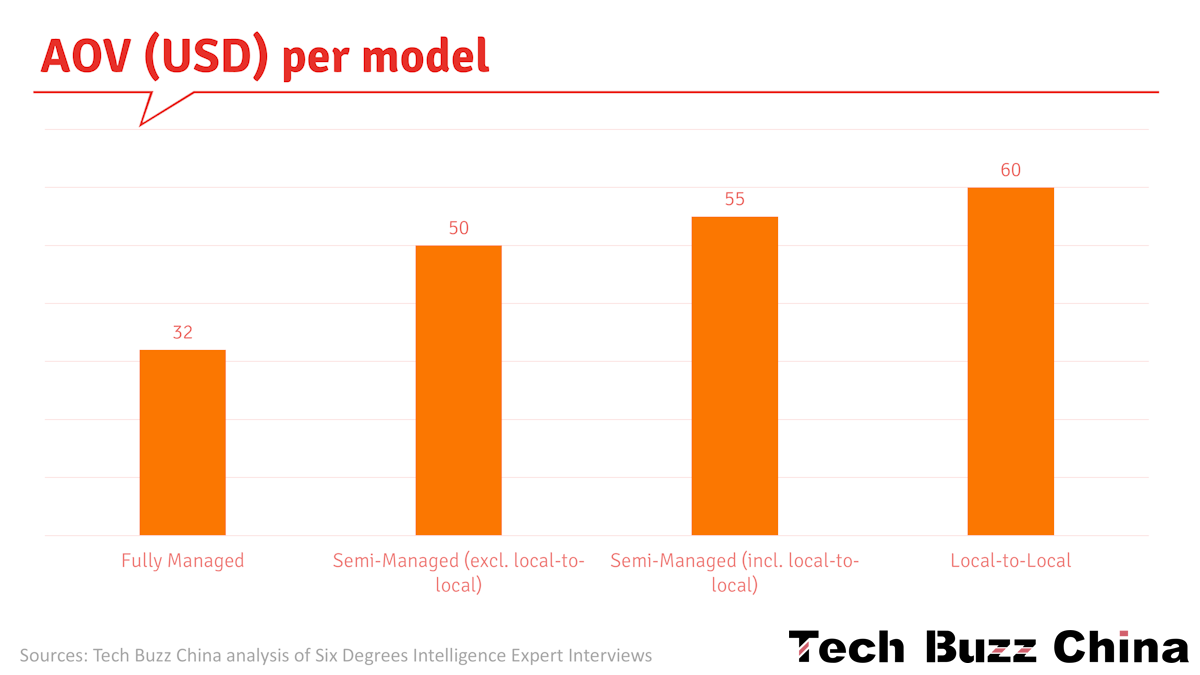
Globally, the average order value for fully managed services is $32, while for semi-managed services it’s $55 (Note: another expert claimed these figures were $30 and $41, respectively). Temu’s semi-managed business has an average order value that is 72% higher than that of fully managed, but a profit margin of only 4-5%.
An expert noted that further analysis of the order value composition for semi-managed services shows that the average order value is driven by local-to-local models, with local-to-local orders averaging approximately $60 and semi-managed orders averaging roughly $50, resulting in an average order value of $55. Note: At Tech Buzz China, we question this statement, as it implies a 50/50 split between local and non-local in the semi-managed model. However, last week we reported that local-to-local business still has a limited share of GMV, generally less than 5%.
Temu’s main disadvantage in the European market is its generally lower order value. Specifically, in the first half of 2025, Temu’s average order value across its five main European markets rose to $33, up from approximately $30 at the end of 2024. However, outside these five European countries, Temu’s average order value remained roughly $30. In contrast to Temu’s AOV of $33, Shein’s average order value in the five European countries was approximately $50, significantly higher than Temu’s.
In the US market, the average order value rose to $40 in October 2025, and was $36 after price adjustment in September.
Price changes in 2024 and 2025
Temu’s subsidy and pricing strategies underwent several phases of change in 2024. From March to July, the platform implemented a subsidy strategy in the early stages of its semi-managed business model, aiming to cultivate merchants’ supply habits and attract users. Specific measures included eliminating advertising fees and commissions, reducing penalties, and providing 15%-20% subsidies on top of merchants’ supply prices. Additionally, the platform offered an extra $2.99 shipping subsidy for packages valued at no more than $30.
Starting in August 2024, the platform gradually phased out subsidies and shifted to a markup model to generate profits. During this phase, the platform added a 15%-20% markup to items with lower discounts (70% off or less), while adding no markup or only about 5% to items with higher discounts (85% to 90% off). From August through the end of the year, the platform’s average markup rate was approximately 10%, with a maximum of 15%.
Temu’s fully managed service pricing strategy also underwent some significant changes between 2024 and 2025. From the beginning of 2024, Temu’s fully managed service pricing remained at approximately 2.5 times the original cost, about 34% lower than Amazon’s similar products, priced at 4 times the cost. This pricing strategy remained unchanged from 2024 to April 2025.
However, starting in April 2025, due to the need to pay approximately 14% in comprehensive taxes through official channels, the pricing multiplier for fully managed products increased from 2.5x to nearly 3x. To counter tariffs on cross-border small parcels, Temu raised prices to 85%-90% of Amazon prices at the end of April. In March, Temu had already made tentative price increases of 15% to 20% on some items. These price adjustment strategies were closely tied to product pricing and had varying impacts across price points. Specifically, lower-priced items saw larger price increases; for example, an item priced at $10 might rise to over $20. In contrast, higher-priced items saw relatively minor price increases.
For example, a product priced at $1.50 would sell for approximately $4.25 under the fully managed model, compared with a typical Amazon price of $5.65. Therefore, the price under the fully managed model is approximately 75%-77% of the Amazon price. The future pricing structure will be adjusted based on consumer acceptance. Even so, the price of fully managed services will remain competitive, expected to stay around 70% of Amazon's price, but not return to the previous 50% level.
Starting in May 2025, the cost structure of different operating models has changed substantially. Changes in U.S. tariff policy have significantly impacted apparel pricing and supply chains under the fully managed model. Under this model, a large volume of goods is transported via forward warehouses and declared compliantly by sea freight. In this case, the tax structure comprises three components: basic tariffs, Section 301 tariffs, and fentanyl-related tariffs. Taking apparel as an example, the basic tariff is 14.9%, the Section 301 tariff is 7.5%, and the fentanyl-related tariff is 20%, resulting in a total tax rate of 42.4%.
It’s important to note that these tax rates are calculated based on the procurement cost of the goods, not the final retail price. For example, assuming a retail price of $40 and a procurement cost of $16 (a 2.5x multiplier), the compliant tax would be $16 × 42.4%, or $6.80. To offset this additional tax cost, the retail price of the goods would need to increase by $6.80, representing approximately a 17% increase from the original price of $40.
Under the fully managed model, suppliers have to reduce their prices by about 5% to maintain sales volume on the platform. Given that the net profit margin for fully managed businesses is typically only 5% to 10%, this price-reduction strategy undoubtedly squeezes suppliers’ profit margins. In this situation, suppliers can offset the 5% profit loss by improving production processes for best-selling products, such as optimising raw material procurement. These strategies can help suppliers remain competitive and maintain profit levels in the new tariff environment.
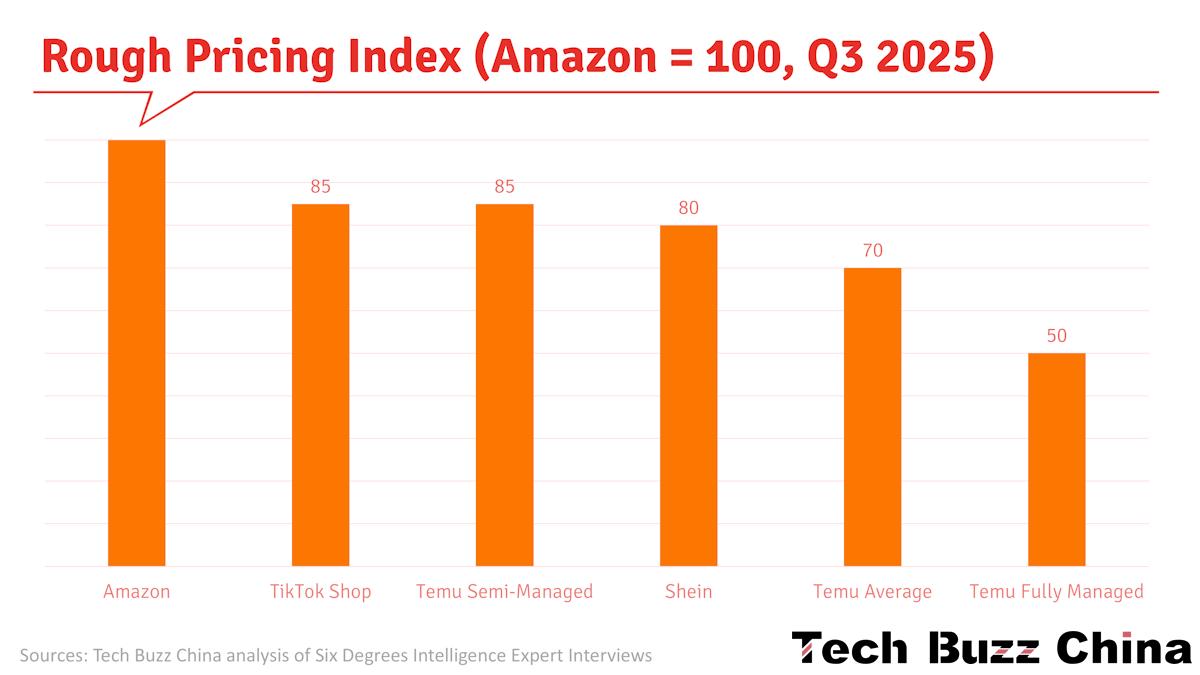
In the third quarter of 2025, due to higher taxes and shipping costs, platform prices generally rose, further narrowing the price gap with Amazon. Currently, Temu’s prices under the semi-managed model are approximately 85%-90% of Amazon’s. This price level is expected to remain stable within this range in the long term.
With service quality remaining unchanged, the market has gradually accepted this price level, which may become a benchmark for future pricing. Many items priced below $5 still exist in the fully managed model; these items have higher profit margins, and the platform will continue to retain them as part of its ancillary business. However, to optimise the overall business structure, the platform will shift its core business to the semi-managed model.
These changes have significantly affected Temu’s price competitiveness relative to Amazon. Although Temu’s price advantage has weakened, it still maintains a relatively low price level, which may continue to attract price-sensitive consumers.
While Temu’s prices for both fully managed and semi-managed goods increased, sales volume did not decline significantly. From a cost-management perspective, the platform itself has not borne the cost pressure from tariffs. It has passed on the tariff costs to consumers by raising prices and reducing product subsidies. Compared with other cross-border platforms such as Amazon and Shein, Temu’s price increases have been relatively small.
In the European market, Temu still has a competitive advantage due to the exemption of small-parcel tariffs. Theoretically, fully managed goods are priced at approximately 60% of Amazon’s prices, while semi-managed goods are priced at approximately 80%. However, as we discussed in Temu Watch #10, the EU is preparing to implement various import taxes on small packages from outside its borders in 2026.
Returns
Temu’s order payment rate is strong, exceeding 80%, but it faces return issues. Approximately one-seventh of its goods are returned after purchase, and this figure can reach as high as one-fifth during peak return periods. In contrast, Shein boasts a higher payment conversion rate of over 85%, but its return rate is higher, with about 20% of goods returned, primarily due to size and style issues with clothing. Across the industry, the order-to-pay conversion rate typically exceeds 80%, while the average return rate for various products ranges from 10% to 15%.
Pricing and User Retention
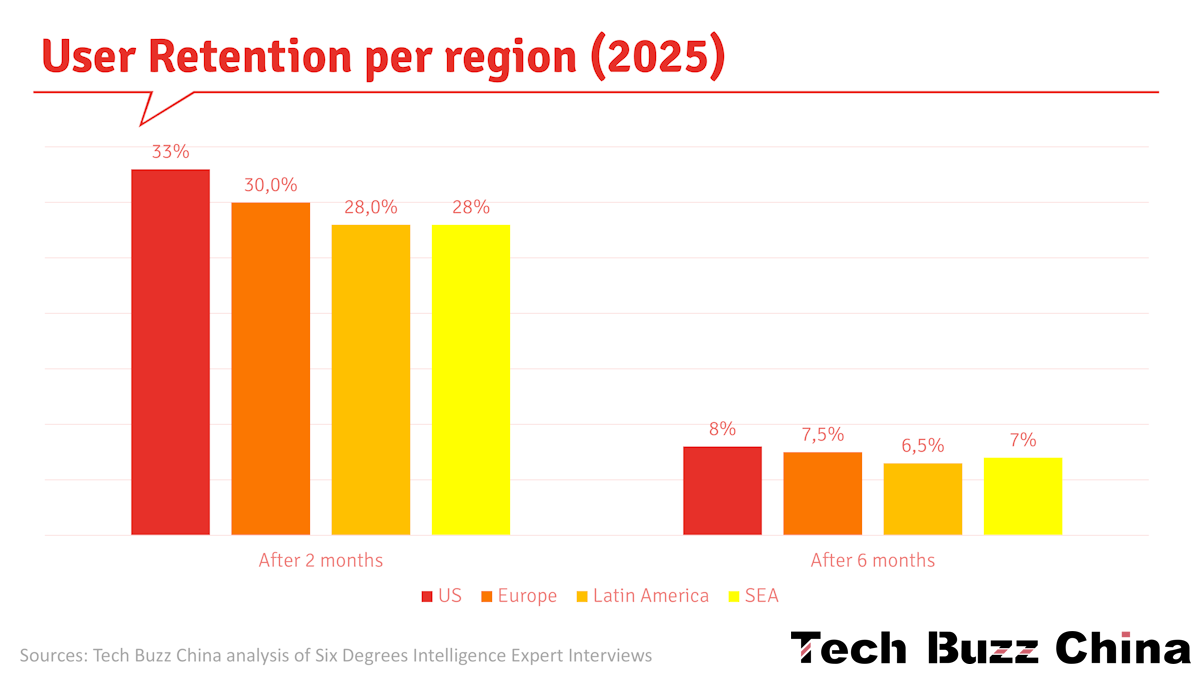
Data from regions worldwide indicate a significant decline in Temu’s user retention rates. In the US market, the retention rate in the second month is 33%, but drops to 8% after six months. The situation is similar in Europe, with a 30% retention rate in the second month and 7.4%-7.5% after six months. Latin America is also performing poorly, with a retention rate of approximately 28% in the second month and around 6.5% after six months. Southeast Asia faces similar challenges, with a retention rate of approximately 27%-28% in the second month and around 7% after six months.
One fundamental reason for the low user retention rate is the substantial subsidies platforms offer to new users. These include free first orders, 30%-50% discounts on second orders, and 30% off third orders. This strategy leads some users to stop using the platform after they have enjoyed these discounts.
Complicating matters further, intense market competition means platforms such as Shein, Amazon, and AliExpress also offer product subsidy policies. In Southeast Asia, Lazada and Shopee still hold an advantage in pricing, and users typically return to their original platforms after promotional events end. In the Latin American market, MercadoLibre and Amazon have large, loyal user bases, and their user behaviour patterns are similar to those in Southeast Asia.
Competition
Temu’s competitors in the European market include Amazon, AliExpress, and some independent sites. However, AliExpress is relatively small, and independent sites are fragmented among different countries; therefore, Temu’s differentiated competitive advantage is unlikely to be surpassed in the short term.
To understand the competitive landscape Temu faces in the European market, we need to analyse it from several key dimensions. First, regarding timing, Shein launched its semi-managed service in five European countries a few months after Temu did. However, Temu’s semi-managed business in Europe has lagged behind its US operations, primarily due to intense competition from Shein and product homogenization among merchants.
Nevertheless, Temu remains a leading player in the fully managed business, primarily due to its diverse product range and competitive pricing. Regarding product overlap of semi-managed goods, approximately 70% of Temu’s product portfolio overlaps with Shein’s, and about half of Temu’s product categories are the same as Amazon’s. But while Temu and Shein have 70% product overlap, Temu has differentiated its products, similar to the competition between Tmall and JD.com in China.
In terms of pricing strategy, Temu primarily sells low-priced goods, whereas other platforms tend to focus on mid- to high-priced products. At the level of direct competition, Temu and Shein directly compete on approximately 30% of their products, with identical SKUs. In contrast, Temu directly competes with Amazon on approximately 20% of its products. This competitive landscape will significantly impact Temu’s future profitability and its expansion of market share in Europe.
Product ranges
Compared to Temu, Shein has a greater number of SKUs across fashion categories such as apparel, bags, and accessories. Shein primarily focuses on offering curated fashion apparel, resembling a large, specialised platform. In 2022 and 2023, sales revenue from these categories accounted for more than 60% of total revenue. In apparel, Temu has fewer merchants and fewer SKUs than Shein.
Since 2022, Shein has ventured into the third-party platform business, expanding its non-apparel product range. However, it still lags behind Temu in product diversity and in price competitiveness. Shein still holds an advantage in home furnishings and textiles, especially textiles. However, aside from textiles, Shein’s strategies across other categories have not been ideal, particularly in the European and American markets, due to higher average order values and limited price competitiveness. In contrast, Shein’s expansion in the Southeast Asian market has been relatively successful.
Temu and Shein’s product offerings are expected to become increasingly similar. In contrast, Temu’s product range is approaching Amazon’s level and surpasses Shein's in the broader e-commerce landscape.
From a competitive differentiation perspective, Temu’s semi-managed business overlaps significantly with merchants on other platforms; however, its fully managed products have about 5% overlap with Amazon and about 10% overlap with Shein.
Temu and Amazon have low overlap in fully managed goods, primarily due to differences in their product category structures. Temu’s business is focused mainly on three product categories: apparel, electronic accessories, and large-volume goods (semi-managed), which were gradually introduced starting in the second half of 2024.
Amazon primarily sells apparel, electronics, accessories, and branded goods, including cosmetics. Notably, Amazon places greater emphasis on brand value, while Temu tends to prioritise cost performance. This strategic difference is reflected in the two companies’ best-selling products: although there is about 60% overlap, the specific products are not identical. The non-overlapping 40% of best-selling products are primarily high-performing, profitable bestsellers on Amazon, as well as higher-priced or higher-quality items. Furthermore, Amazon remains the primary sales platform for large semi-managed goods.
Amazon also covers areas such as food, books, audio equipment, and publications, which Temu cannot access. Furthermore, Temu has attempted to sell licensed IP merchandise, such as Disney toys. Still, due to regulatory and licensing restrictions, these products can only be sold in the Chinese market and cannot be exported. In terms of scale, Amazon has hundreds of millions of SKUs, while Temu only has tens of millions, a significant difference.
Still, while Amazon and Temu differed in their early product categories, their product ranges have become increasingly similar in recent years.
Temu is gradually narrowing the gap with Amazon in user experience and pricing (see below). Currently, Amazon’s average delivery time in the US is 3.1 days, while Temu’s is 3.5 days. This improvement in logistics efficiency is primarily due to the growth of commercial express delivery and the deployment of forward warehouses (see Temu Watch #8).
Regarding inventory management, Temu’s semi-managed model leads to faster inventory turnover and a “frequent, small-quantity” replenishment strategy. They typically adjust inventory based on a 20-30-day ocean freight window. In contrast, Amazon, due to the characteristics of long-tail products, may have lead times exceeding 60 days for some best-selling items.
Looking ahead, the main competition will be between Temu and Amazon. Temu is attracting some of Amazon’s middle-class customers. However, many Amazon users may have high trust in the quality of its goods and services and are less concerned about minor price differences. Nevertheless, although Temu’s growth rate may slow, it is still expected to outpace Amazon slightly.
Pricing differences
Three different experts close to Temu gave slightly different assessments of Temu’s relative pricing:
Expert 1:
From a price-competition perspective, the pricing strategies of major platforms differ significantly. Amazon’s prices are the highest, followed by TikTok, with Shein’s prices slightly higher than Temu’s, while Temu’s prices (fully managed) are the lowest. Taking the price range in the Chinese market as a reference, Amazon’s products are priced between RMB 30-40, TikTok around RMB 30, Shein between RMB 27-30, and Temu between RMB 20-25.
Expert 2:
There are significant differences between Temu and Amazon in pricing strategies and operating models. Prices on Temu (fully + semi-managed) are generally about 20% lower than on Amazon. This is mainly attributed to Temu’s lower commissions and advertising fees.
Under its fully managed model, Temu’s product prices are typically only 50% to 60% of Amazon’s, sometimes even as low as 30%. For example, for a product costing RMB 10, Amazon usually prices it at 3 to 10 times the cost, typically selling it for RMB 40 to RMB 60. In contrast, Temu prices it at 2.5 times the cost, plus a 20% channel profit margin, resulting in a final price of around RMB 30.
Under the semi-managed model, Temu adds a 10%-15% fee to the merchant’s quoted price, but the final selling price is still lower than Amazon’s. Temu’s semi-managed model typically results in prices 10% to 30% lower than Amazon’s. This is primarily because Amazon allocates over 20% of its sales to advertising and commissions, while Temu calculates profits based on supply prices and has lower logistics costs.
Under the semi-managed model, Temu’s pricing strategy differs slightly. The initial price of a product is typically set at 70% to 90% of similar products on Amazon. After the platform review, the initial price is increased by 10% to 15% as a profit margin. In this model, merchants bear the costs of initial transportation, warehousing, and last-mile logistics, while the platform profits by adding a markup. This operating model allows Temu to maintain price competitiveness while ensuring a certain level of profitability.
Expert 3:
In the five main European markets, Temu’s semi-managed goods are typically priced at 80% to 90% of Amazon’s prices. During promotional periods, Temu prices may drop to below 20% of the original price, but most items are still discounted by 80%-90%. Discounts of 70% to 80% are rare and typically appear only during major promotional events.
Compared to Shein, Temu’s prices are typically 85%-95% of Shein’s, with a minimum of 80%. In the first half of the year, Temu attempted to attract some of Shein’s high-quality merchants. Still, because Temu offered only a 5% discount, merchants were not very enthusiastic about switching. Overall, Temu has a greater advantage in price competition with Amazon, but less so with Shein.
Temu’s fully managed products are typically priced at 40%-60% of Amazon’s prices and 50%-70% of Shein’s prices, demonstrating a significant price advantage. This pricing strategy allows Temu to achieve effective differentiation in the fiercely competitive e-commerce market.
The gap between Temu and Amazon is also gradually narrowing. Following tariff adjustments, prices for some popular products have approached Amazon’s levels, but Temu still maintains a price advantage. To maintain market competitiveness, the platform employs forward warehouses or semi-managed models (see Temu Watch #8), reflecting the profound impact of the new tariff policy on cross-border e-commerce pricing strategies.
Especially during the major promotional event from September to October 2024, Temu’s prices rose from 50%-60% of Amazon’s to 70%-80%, further narrowing the price gap between the two. In the past, Temu’s prices were 30%-50% lower than Amazon’s, but they have now risen to 85%-90% of Amazon’s.
Amazon and Temu each possess unique competitive advantages. Tariffs have somewhat weakened Temu’s price advantage, and Amazon maintains a strong competitive edge thanks to its powerful brand influence and solid customer loyalty. Against the backdrop of high inflation, some consumers have become more tolerant of price increases, making them more inclined to choose established platforms like Amazon. Despite its diminished price advantage, Temu continues to attract consumers who value cost-effectiveness. This pricing advantage is effective not only in the US market but also in Europe, Japan, and South Korea.
Consumers’ final decision on which platform to choose depends on advertising effectiveness, price satisfaction, and promotional activities during the shopping season. By extending its Black Friday and Cyber Monday promotional periods to 40-60 days, Temu broke the traditional 2-3-day shopping cycle, fundamentally changing consumer shopping habits. Faced with this challenge, Amazon adjusted its strategy, extending the promotional period to approximately 10 days: a 3-day pre-sale period, a 5-7-day promotional period, and a 3-day closing period. Ultimately, merchant choices and platform competitiveness are influenced by the support and subsidy policies offered by the platform; these factors collectively determine each platform’s market position in the fiercely competitive market.
Merchants
Temu currently employs various operating strategies, including
fully managed (Chinese merchants + global delivery by Temu)
semi-managed (Chinese merchants + local delivery)
Y2 (Chinese merchants + global delivery)
local-to-local (local merchants + local delivery)
Merchant profitability
Under the fully managed strategy, merchants’ gross profit margins are approximately 10%-15%, and after deducting penalties, refunds, returns, and labour costs, the final EBITDA is approximately 3%. Despite limited profit margins, merchants remain actively involved due to high transaction volume and short payback periods.
In contrast, other strategies have procurement costs accounting for 35%, return fees for 8%, zero platform usage fees, and promotion and marketing expenses reaching up to 8%. Warehousing, fulfilment, and distribution costs account for approximately 24%, labour costs for approximately 3%, and total design, R&D, and capital expenditures for approximately 1%-2%. The overall gross profit margin for merchants is substantial, at approximately 20%.
Merchant advertising
There are significant differences in advertising income strategies among major e-commerce platforms. Amazon’s advertising expenditure accounts for 12% of its GMV, covering both on- and off-platform channels. In contrast, Temu’s fully managed service has no advertising income, while its semi-managed service began offering advertising in the US in the second half of the year, with rates between 4% and 5%, totalling less than 2% annually. Shein’s advertising income on third-party platforms is 5%, while its self-operated supply has no advertising income.
Temu has experimented with allowing sellers to advertise in a semi-managed model in the Americas and Europe (see Temu Watch #9), but this has had little impact on the profitability of the semi-managed business in the short and medium term. Sellers in the US have little interest in advertising, and the situation is similar in other regions. Merchants generally believe that product prices on the platform are already very low and are unwilling to increase advertising costs. Sellers prefer to advertise on platforms like Amazon, where prices are higher, to achieve higher profits. Even with current advertising fee discounts or rebates, sellers remain unwilling to advertise on Temu, largely because Amazon’s advertising is more effective.
Sellers with established brand recognition in the US market, such as DJI, Anker Innovations, and Xiaomi, allocate their advertising budgets across multiple platforms, including Temu and Amazon. Their advertising spending is relatively stable. In contrast, small and medium-sized sellers who rely on platforms for survival are generally less motivated to advertise in normal circumstances, participating only during major promotional events such as Black Friday. Temu’s current advertising revenue is small, and this is not its primary development direction.
The advertising feature launched in March; before that, revenue in January was primarily from commissions and penalties. When the advertising feature was first launched, the proportion of advertising income was relatively low, accounting for only about 2% of total revenue, and many categories had not yet begun advertising. Notably, advertising spending decreased in April. However, by May, advertising spending had returned to normal, and the proportion of advertising revenue rose to approximately 3%. In recent months, the GMV share of fully managed services has decreased, while the share of semi-managed services has increased, and advertising income has risen accordingly. In the US, Temu’s semi-managed business accounts for 70% of its total business, with advertising expenditure exceeding 5% of payment amount, while its fully managed service has no advertising expenditure.
Temu’s advertising revenue will account for over 5% of its total revenue by the second half of 2025, primarily driven by this growth in its semi-managed local business. However, given the low gross margins on platform goods, the scale of advertising income may be limited, making it unlikely that advertising revenue will reach a very high level.
GMV & Profitability Goals
GMV Growth
Since the beginning of 2025, Temu’s GMV has been trending upward, with only a decline in May due to the tariff situation. The month-on-month growth rate between January and August remained between 6% and 8%.
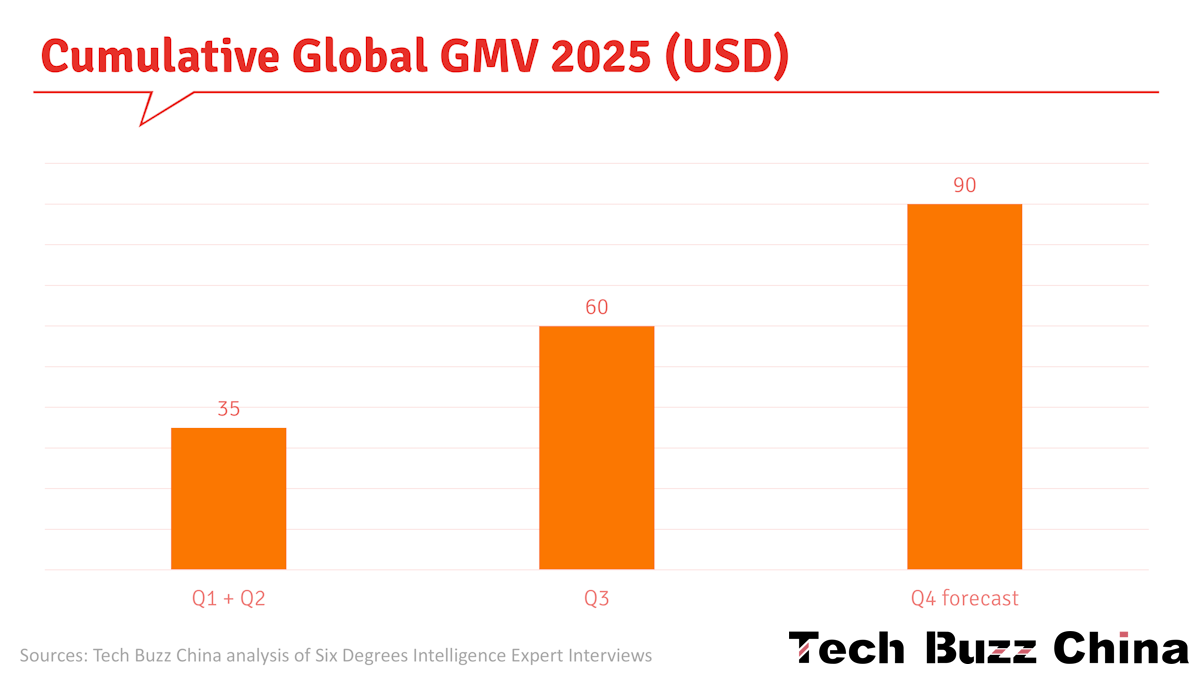
Based on Temu’s transaction performance data, the company’s total merchandise transaction volume reached approximately $24 billion in the third quarter of 2025. Looking back at the first six months, Temu’s total transaction volume reached roughly $35 billion, and by the end of the third quarter, it would approach $60 billion.
Looking ahead to the fourth quarter, if transaction volume reaches $30 billion, the total transaction volume for 2025 is projected to be close to $90 billion. Although the company’s full-year transaction volume target for 2025 remains $100 billion, estimates suggest it will likely be between $90 billion and $95 billion. Therefore, based on this analysis, Temu will face a target shortfall of approximately 5-10%, making it difficult to meet its $100 billion annual transaction target fully.
Temu’s business growth in the US fluctuated in 2025. The first-quarter growth rate was approximately 60%, a slowdown from 100% in the same period of 2024. Starting in early April, due to tariff policy adjustments and inventory issues with the fully managed model, the platform raised prices in early May, causing business growth to nearly stagnate. However, in June, as these effects subsided, the growth rate rebounded to approximately 20%. In mid-July, Temu increased its advertising investment, further boosting growth to 40%-50%. Overall, Temu’s business growth in 2025 gradually recovered after hitting its lowest point in the middle of the year, but it is unlikely to return to double-digit growth.
Cost & Profit Structure Fully Managed Model
As mentioned, under a fully managed model, the selling price of goods is typically 2.5 times their cost. For example, a product costing RMB 10 might be sold for approximately RMB 25.
The most significant change in expenses in 2025 was in traffic acquisition costs (advertising). While the total amount spent on traffic acquisition increased in 2025, its percentage will decrease compared to 18% in 2024. There is limited room to reduce traffic acquisition costs, which must remain above 10%. Marketing expenses currently account for about 15%, a decrease from over 30% in 2023.
Logistics costs will remain high and difficult to reduce starting in 2025. In general, logistics costs are expected to rise by 10% to 15% for the whole of 2025. The proportion of logistics costs to sales revenue for US routes increased in stages throughout 2024 and 2025. This proportion was between 25% and 28% in the first quarter of 2024, remained around 28% in the second and third quarters, and rose to 30% in the fourth quarter.
The figure for the first quarter of 2025 is similar to that at the end of 2024, remaining around 30%; it began to rise from March, reaching 35% in the second quarter, and this trend is expected to continue into the fourth quarter. In contrast, logistics costs for European routes have not changed much; however, in the first half of 2025, due to the Red Sea incident that altered sea routes, expenses increased by approximately 10%.
Domestic warehousing costs are declining, accounting for 5% in 2024. By 2025, labour costs will drop to 3% through increased warehousing capacity and greater automation. Domestic warehousing costs have no further room for reduction.
International logistics costs mainly consist of three parts: initial transportation, warehouse management, and last-mile delivery. Last-mile delivery costs account for the highest proportion, approximately 50%; initial transportation costs account for 20% to 30%; and warehousing costs account for approximately 20%. Warehouse costs are relatively stable, whereas last-mile delivery costs are directly tied to order volume. As order volume increases, the unit delivery price may decrease.
The cost structure of the US operations primarily consists of delivery costs and customer acquisition fees. In the US, due to limited investment in social media and television advertising, customer acquisition costs are roughly equivalent to delivery costs, at around $10 per order. Considering taxes and other expenses, the fully managed model may struggle to be profitable without Temu using its own warehousing or reducing some tax burdens. Currently, US operations are slightly unprofitable, but profitability is expected once the two self-built warehouses are fully operational and the expenditure structure stabilises. Once warehouse operations are stable, the handling cost per item is expected to be controlled between $0.50 and $0.60. After deducting delivery and warehouse handling costs, the remainder will become profit.
Based on the information shared in this report and Temu Watch #10, we have made the cost breakdown below. While the fully managed model remains unprofitable and will continue to make losses as long as it uses a significant share of air transport, the estimated 5% loss is an improvement from the -27% in mid-2023 and -13% in mid-2024 we previously estimated in Temu Watch reports.
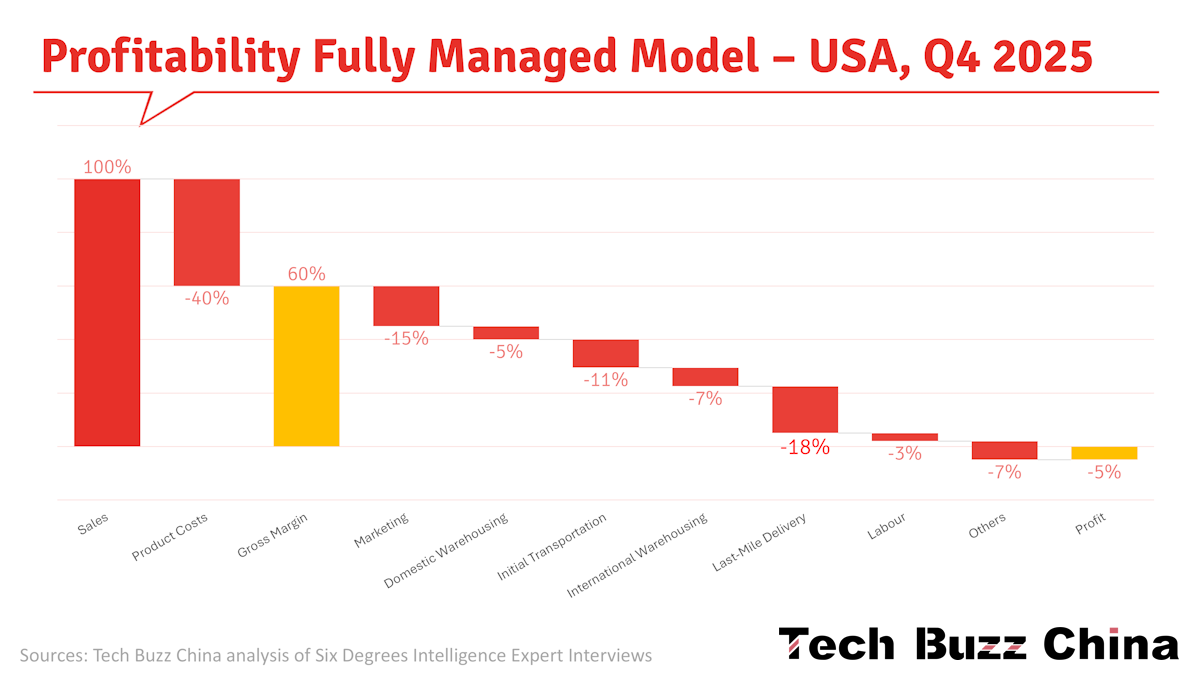
Note: Based on a 50/50 split of air and sea freight and their respective loss rates, we estimate a 5% loss for Temu’s fully managed business in the US. To get to this figure, we have added a 7% ‘others’ category. This category was 5% and 8% in the analyses of 2023 and 2024, so it seems reasonable. The experts mentioned no specific customer subsidies, but subsidies for the fully managed model in the US have been significantly reduced from the 20% in 2023 and 2024. In the above chart, they are not separately mentioned, but could be included in the ‘marketing’ or ‘others’ categories.
Cost & Profit Structure Semi-Managed
Temu’s revenue model is primarily based on a semi-managed model. In this model, merchants ship within the United States (or Europe), and the platform’s primary revenue sources are advertising fees and last-mile delivery services.
Starting in 2025, the platform’s profit model has become more diversified. Specifically, from March 2025, advertising fees were charged for semi-managed products on the US site. Merchants are generally willing to advertise due to the high weight of ads and the typically high ROI exceeding 2. Advertising fees may not exceed 5% of sales.
Starting in July 2025, all shipments must use the platform’s electronic waybill system. The platform profits through price differentials. Specifically, the platform purchases services from logistics companies at 65%-70% and sells them to merchants at 80%-85%, profiting from the difference. In addition, the platform charges approximately 2% in comprehensive fees and penalties.
Regarding product pricing, the mechanism for merchants to submit supply prices is stable. Typically, merchants set prices at 70%-90% of Amazon’s, and the platform adds a markup. This pricing strategy helps the platform remain competitive while achieving profitability. Specifically, for products offered by merchants at 70% of the Amazon price, the platform adds a 15% markup as the gross profit.
In April 2025, the platform’s markup policy gradually stabilised, with the average markup across all categories controlled between 15% and 20% to ensure gross profit. As the share of semi-managed business increased, the platform formally enacted various compliance penalties and commission terms in June 2025; these fees will account for approximately 2%.
From June 2025 onward, the overall markup rate for semi-managed products remained above 15%, with no significant change. These measures will optimise the platform’s profit model and revenue structure, while also impacting the revenue of both merchants and the platform. Merchants may need to adapt to the new advertising fees and markup policies, while the platform can use these changes to stabilise and increase its revenue.
Although the final selling price on the front end is not as significantly different from Amazon’s price as it was in the early days of the fully managed model, it still generally remains between 85% and 90% of Amazon’s price. This pricing strategy maintains the platform’s competitiveness while also preserving a certain level of profitability.
Temu’s semi-managed services see limited profitability, which stems from several factors.
The fee structure of semi-managed services is relatively simple, excluding traffic acquisition costs (advertising), which are all categorised under fully managed services.
Regarding subsidies, Temu’s semi-managed services receive approximately 30% subsidies, although this varies slightly by country. Due to higher pricing for semi-managed products, the subsidy ratio for semi-managed services exceeds that of fully managed services (20-30% of total costs).
Based on the information shared in this report and Temu Watch #10, we have made the cost breakdown below. Despite the challenges in the US, Temu doubled its profit margin compared to the 2% in 2024.
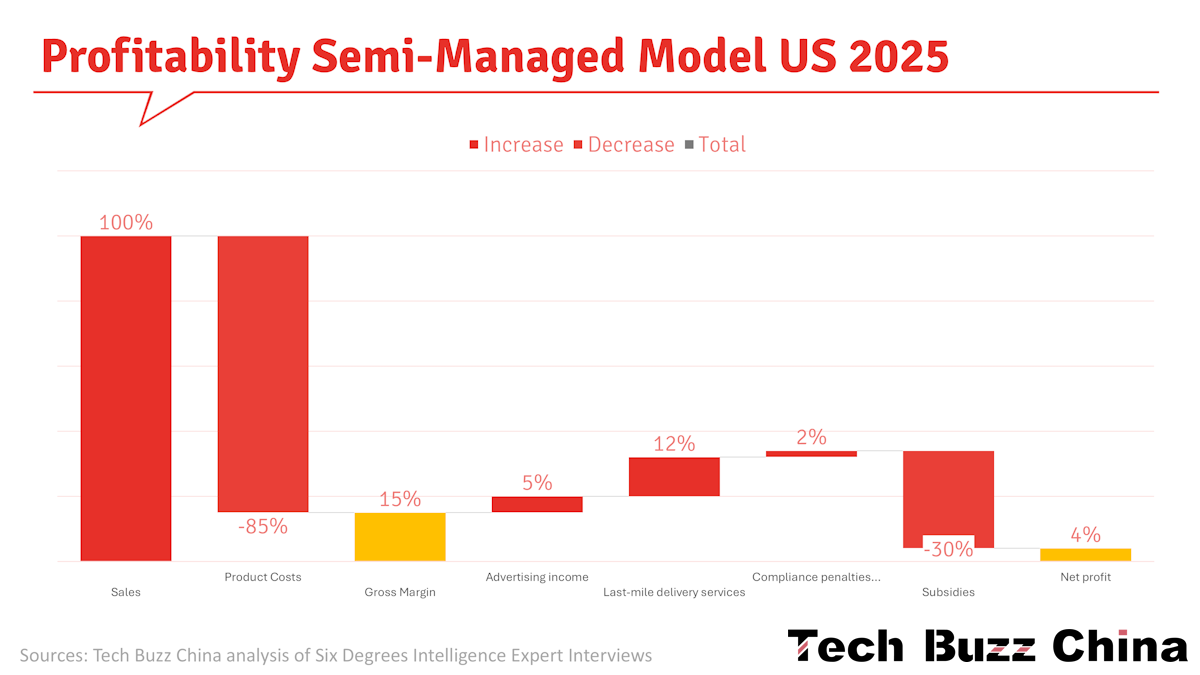
Note: The experts did not provide a specific percentage for income from last-mile delivery services. But to reach a 4% profit margin, it must have been around 12% of GMV. Advertising costs are not allocated to semi-managed and are included in the fully managed model cost breakdown.
Profitability
Financially, Temu’s losses exceeded RMB 20 billion RMB in 2024. By 2025, Temu’s cumulative losses were close to 7 billion RMB, with continued losses expected in the second half of the year. Despite this, markets in Europe, the US, and some Latin American countries are nearing or reaching break-even. The US market, in particular, has begun to achieve profitability, but new tariffs have slowed this progress.
US and European businesses are close to breaking even or are only slightly unprofitable. However, Latin America, Southeast Asia, Japan, and South Korea remain unprofitable, primarily due to higher user acquisition costs and marketing spend. Specifically, losses in Latin America are mainly due to affiliate programs and advertising expenses; losses in Southeast Asia and Japan are related to courier service contracts; and the construction of a distribution centre in Gyeonggi Province, South Korea, in cooperation with Lotte, has also increased operating costs. Overall, costs for user growth and logistics are within a manageable range, but expenses related to machinery, equipment, and self-operated warehousing are the primary drivers of the losses.
With Black Friday and other promotional events, achieving year-end break-even requires improving performance for local-to-local and certain managed services. In European and American markets, some managed services have reached their growth limits and need to rely on local business to drive further growth. To optimise the overall profit model, Temu needs to reduce the GMV share of fully managed services and increase the proportion of semi-managed and local-to-local services. Recent months have seen concentrated local-to-local business development activities.
USA
The current situation in the US market is complex. In the fourth quarter, Temu will face intense competition from Amazon and Shein, posing a significant challenge to profit growth. In this environment, the short- and medium-term strategy for the US market is to achieve GMV growth and break-even simultaneously; however, due to weak first-half performance, GMV growth takes priority over the break-even target.
From a cost-pressure perspective, Temu’s gross profit margin is limited. Temu adjusted product prices in the US market in June 2025 due to increased tariffs, with overall prices rising by 15% to 20%. In September 2025, prices in the US market were adjusted again, with overall prices rising by more than 10% from April; however, given the time frame, this increase is relatively small.
After the US market entered its peak sales season in October 2025, the gross profit margin was expected to remain largely unchanged or decline slightly. Specifically, the gross profit margin in the US market will decrease from the previous range of 60%-65% to approximately 60%, primarily due to tariff policies. Overall, the competitive environment in the US market is very intense, and the room for gross profit improvement is limited. In the past, the US market outperformed Europe in average order value and gross profit, but the two are now roughly equal, underscoring the challenges of building a sustainable profit model while pursuing GMV growth.
Gross margins are 5% higher in the US market than in Europe. However, air freight accounts for 25% to 30% of total costs in the US market, compared with only 23% in Europe. The loss for fully managed by air freight in the US is approximately 7% to 9%, while the loss for ocean freight is about 1%, nearing break-even.
In the US, ocean freight costs are 2% to 3% higher than in Europe, while promotional expenses are 1% higher, accounting for approximately 13% of total costs. In the US fully managed services market, air freight and ocean freight each account for about half. By July 2024, the US semi-managed business had reached break-even. By 2025, net profit had doubled, growing from 2% to 4%. Subsidies accounted for approximately 30%.
Europe
In the short- to medium-term strategy for the European market, achieving break-even is the primary objective, followed by increasing GMV. Although the GMV levels of the five European countries are comparable to those of the US, achieving break-even remains the top priority.
Financial performance data from the second and third quarters of 2025 indicate that Europe is the most likely region to achieve sustainable profitability in the near future. The second and third quarters of 2025 are crucial periods. Europe performed exceptionally well in the second quarter, with data showing the platform achieved near-zero losses. From a global perspective, Europe’s revenue and expenditure are essentially balanced, with a slight surplus, and the overall deficit is expected to fluctuate between -1% and +1%.
The entire European region is expected to break even in December 2025.
The UK stands out among European countries, primarily due to its higher average order value. Goods are typically shipped to Germany first and then transshipped to the UK. The UK was projected to break even by October 2025, with an overall profit margin of approximately 1% and a small surplus. It is expected that the five major European countries will achieve break-even by the fourth quarter of 2025, and their strong performance will help the overall European market reach profitability.
Other regions
In contrast, other regions exhibit varying performance characteristics. Latin America is currently in the investment phase, with a smaller deficit, estimated at 1%-2%. The Southeast Asian market is performing steadily, but market entry in Indonesia faces significant challenges, and the overall deficit remains between 1% and 2%. Although Central and Eastern Europe, including Poland, is less active than Latin America, it has largely avoided losses, with deficits remaining between 1% and 2%.
This regional differentiation will significantly impact global business strategy. Europe’s strong performance indicates that the region has the fundamental conditions to achieve sustainable profitability. In contrast, other regions, although still in the investment return phase, have manageable overall risks, providing important reference for future strategic planning.
Outlook
Experts estimate a GMV target of $140 billion for 2026, an estimated 55% increase from 2025.
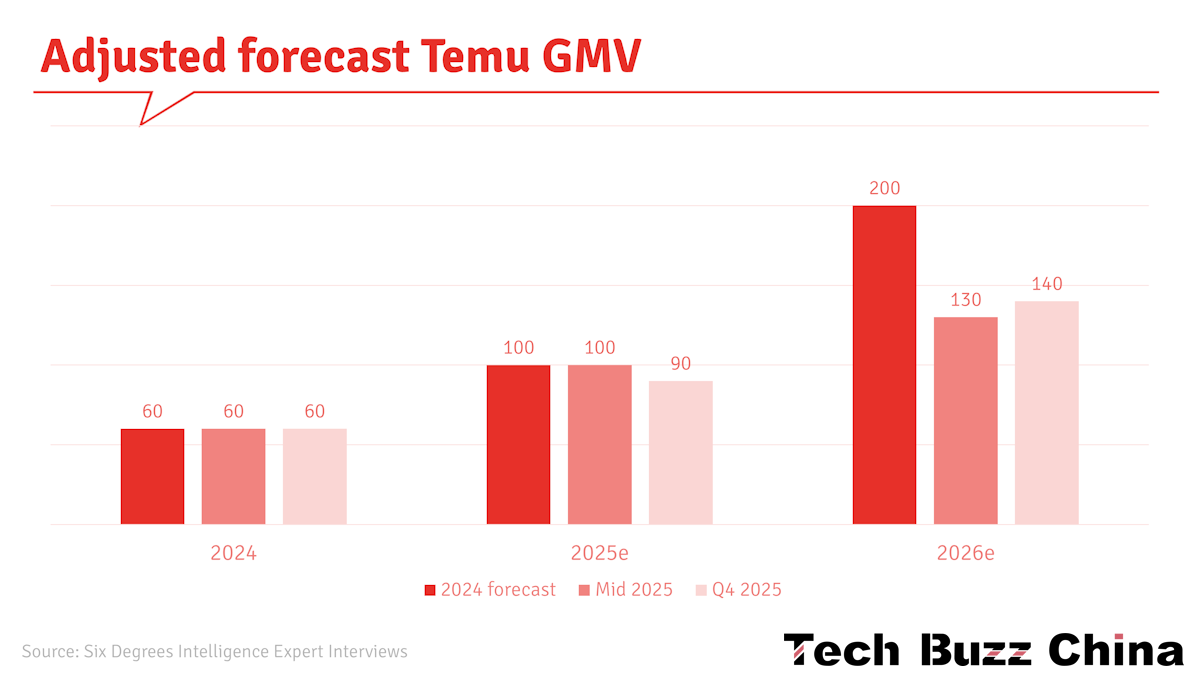
Two experts shared different estimates for Temu’s annual GMV: $70-80 billion and $100, respectively. The latter expert said Temu plans to achieve a total merchandise volume (GMV) of $100 billion by the end of 2025, a target equivalent to one-fifth of the $500 billion market size of China’s cross-border e-commerce platforms. This expert claimed Temu has set a target of $150 billion in GMV in 2027, following China’s cross-border e-commerce market growth from $500 billion in 2025 to $750 billion in 2027.
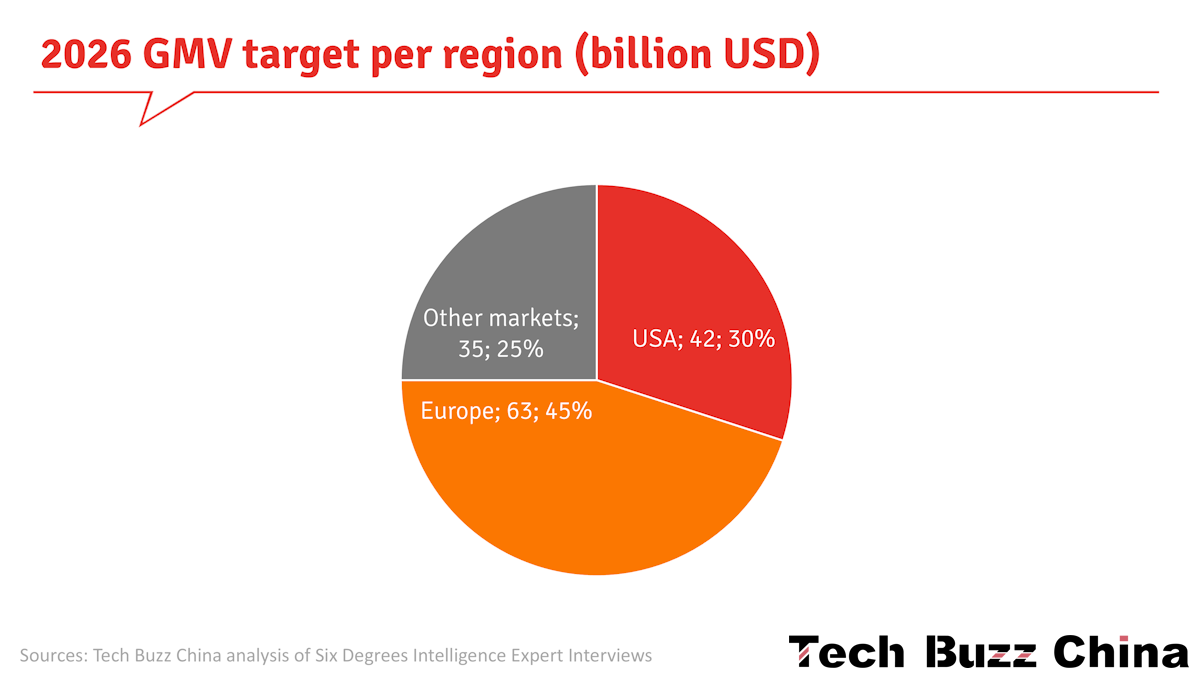
The US market is expected to account for up to 30% of global sales, but this is subject to significant uncertainty and risk. In the best-case scenario, the European market could account for 40%-45%. Meanwhile, other markets could contribute up to 25% of the total. Emerging markets will be a key focus in 2026, accounting for about one-third of GMV, with Latin America as the primary driver.
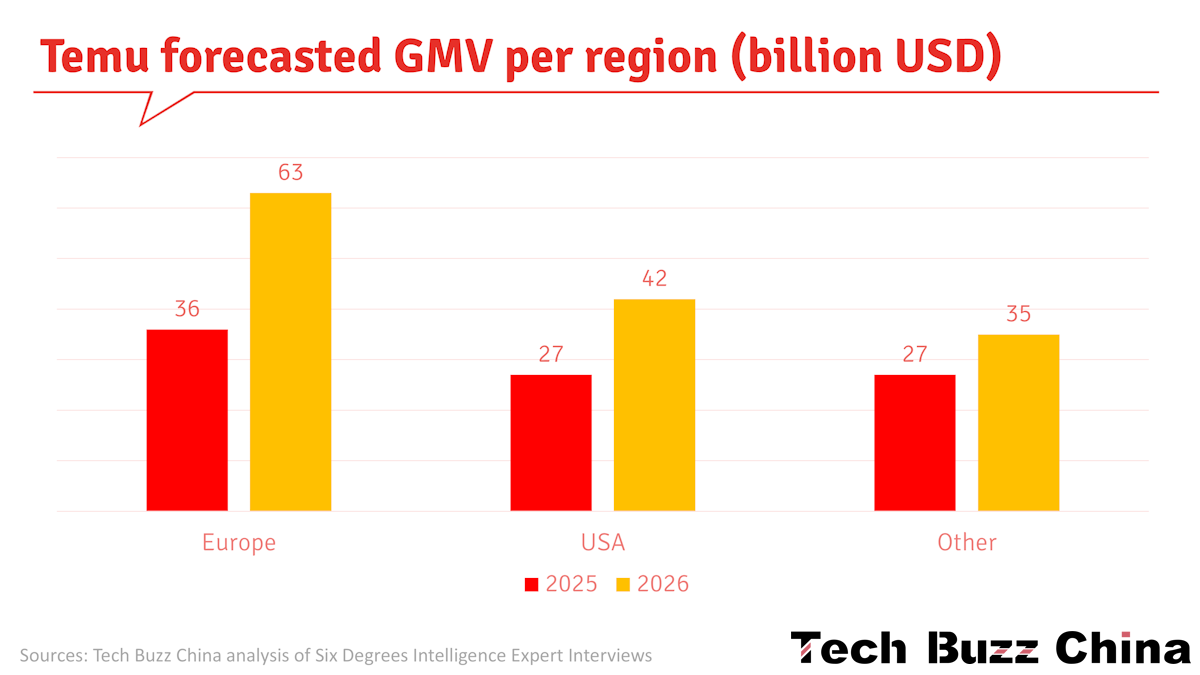
Combining the data above provides estimates of GMV per region for 2026 compared to 2025.
To optimise its cost structure, Temu is implementing several measures. First, by reducing high-cost advertising, such as Google, Meta, and Super Bowl ads, the company plans to reduce customer acquisition costs to $7-8, with the goal of keeping it below $10.
Regarding logistics, forward logistics costs range from $2 to $3, but returns can more than double that to over $4. To manage this, Temu sends returned goods to its US-Mexico Jitu warehouses, where they are repackaged and resold to reduce losses. Furthermore, Temu is optimising its return management process through its Pan-American, Pan-European, and Pan-Latin American networks. To further improve fulfilment efficiency, Temu is piloting “community delivery” services in the UK, Germany, and France (see Temu Watch #10). These combined measures aim to optimise cost structures, improve logistics efficiency, and ultimately achieve profitability.
Temu’s goal for 2026 is to reduce losses and strive for break-even. Small losses are acceptable in some regions, such as Southeast Asia, but profitability is essential in key markets and overall business. While specific profit targets have not yet been determined, clear minimum standards have been set. The main objective is to ensure daily profitability in the US and European markets while achieving break-even for global operations. Based on current plans, global break-even is expected in the first half of 2026, with a slight profit expected to begin in the second half.
Key Takeaways & TL;DR Video Summary
Profitability Goals: Temu’s main goal is to achieve daily profitability in the US and European markets, targeting global break-even in the first half of 2026, with slight profit expected in the second half.
European Market Performance: The European region was projected to reach break-even by December 2025, with the UK anticipated to be profitable sooner (by October 2025), positioning Europe as the most likely region to achieve sustainable profitability in the near future.
Strategic Business Shift: Temu is shifting its core business focus to the semi-managed model to optimise its overall profit structure, reducing the GMV share of fully managed services.
Advertising Spending & ROI: Temu’s total advertising budget for 2025 is projected to be between 25 billion and 30 billion RMB (approximately $3.5−$4.3 billion). The company strictly adheres to a 40% ROI standard for all new user acquisition and existing user activation activities.
Declining Marketing Expenditure Percentage: Temu’s marketing expenditure as a percentage of total transaction volume fell from above 20% in early 2024 to approximately 12% by August 2025, with the long-term goal of keeping it below 10%.
Narrowing Price Gap: Due to US tariff adjustments and subsequent price increases (15% to 20% in June 2025 and over 10% since April), Temu’s prices under the semi-managed model are now approximately 85%- 90% of Amazon’s, significantly narrowing the competitive price advantage.
GMV Target Shortfall: While Temu’s full-year transaction volume (GMV) target for 2025 was $100 billion, estimates suggest the total will likely be between $90 billion and $95 billion, representing a shortfall of approximately 5-10%.
Low User Retention: Temu experiences low global retention; in the US, retention declines from 33% in the second month to 8% after six months.
Returns Challenge: Temu faces significant return issues, with approximately one-seventh of purchased goods returned; this figure can reach as high as one-fifth during peak return periods.
European Competition Metrics: In Temu’s five main European markets, the average order value rose to $33 in the first half of 2025, which is still significantly lower than Shein’s average order value of approximately $50 in the same regions.
The following Google Notebook summary video was created using the Google Notebook tool.
Sources
The information in this report is compiled from exclusive expert interviews within the Six Degrees Intelligence network.
Images by Tech Buzz China’s Ed Sander, unless stated otherwise. These images may not be reproduced without Tech Buzz China’s prior consent.